PEFC Simulation Software Package P-Stack® - Overview
P-Stack® is a simulation software package for estimating power generation performance and analyzing internal phenomena of polymer electrolyte fuel cell (PEFC).
P-Stack accelerates the developments of cells and stacks for PEFC by: revealing internal phenomena that cannot be observed by experiments, reducing the trial manufacturing cost through performance estimations of new cells and stacks, and predicting material degradation under various conditions.
Features
- Rapid estimation of power generation performance and analysis of internal states for full-scale cells and stacks
- Analysis of various internal states, including current density, water content and temperature, under various operating and structural conditions
Catalog
Contact
Department: Science Solutions Division
E-mail: ss-toiawase@mizuho-rt.co.jp
Contact in China
东扬精测系统(上海)有限公司
TOYO Corporation China
TEL: 021-63809633
E-mail: bfc@toyochina.com.cn
URL:https://www.toyochina.com.cn/
- *P-Stack is a registered trademark of Mizuho Research & Technologies, Ltd.
PEFC Simulation Software Package P-Stack® - Concepts
Strategy for Fast Computation
Because internal phenomena in fuel cells are related to multiple physics aspects, computational costs for their simulation tend to be high using general CAE software. P-Stack® rapidly simulates the performance and internal states of full-scale fuel cells and stacks. A drastic reduction of computational costs is achieved by well-validated numerical models such as the MEA model, which reproduce measured I–V characteristics.
Well-Validated Reliable Numerical Model
Numerical models in P-Stack well reproduce not only the I–V curve but also various internal states. The figures on the right hand side present a comparison of the measured and calculated oxygen partial pressure distributions in a cathode channel under different utilization ratios UO2. The calculated results are in good agreement with the measured data for all UO2 cases. Oxygen is consumed almost constantly in low-UO2 condition, while a relatively faster consumption of oxygen is observed in the upper-flow region for UO2 = 80%. These behaviors are also well reproduced by P-Stack. These results indicate that the MEA model in P-Stack can quantitatively estimate oxygen consumption owing to the ORR reaction.
in a cathode channel for different utilization ratios UO2.
The experimental data are provided by the University of Yamanashi, Japan
M. Yoneda, et al., ECS Trans., 11, 1105 (2006). 11th ASME, Minneapolis, (2013)
- *P-Stack is a registered trademark of Mizuho Research & Technologies Institute, Ltd.
PEFC Simulation Software Package P-Stack® - Workflow
Semi-Automated Workflow
The typical simulation procedure using P-Stack is shown in the flowchart below. 3D CAD data of an actual cell and MEA characteristics measured in a mini-cell are required as input data.
Mesh generation from 3D CAD data and the determination of fluid parameters using CFD are automatically performed. These features drastically reduce the required manpower to setup simulations. Combined with the low computational costs of P-Stack, the total work period can be much shorter than that of general CFD-based approach.
- *Automatic meshing from 3D CAD data was implemented based on the algorithm developed by Elysium Co. Ltd. (http://www.elysium-global.com/).
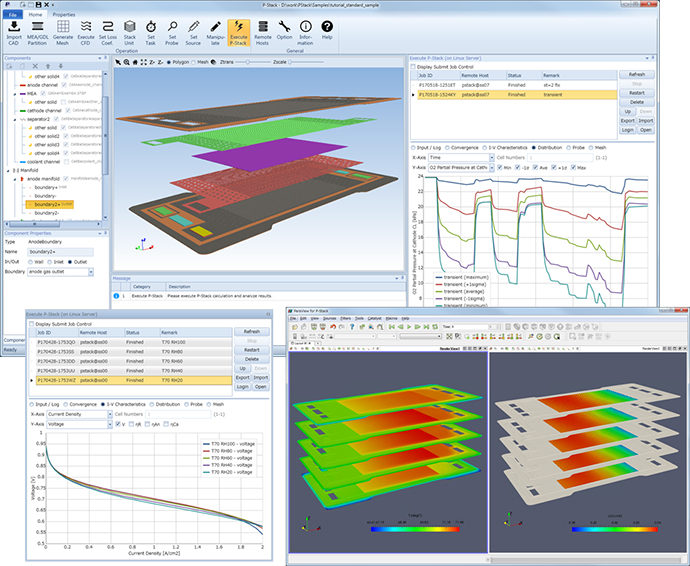
User-Friendly GUI
The GUI of P-Stack is designed such that it can be intuitively used without requiring operation manuals. By sequentially clicking buttons on the ribbon tab, a user can proceed with the workflow steps. The message panel displays directions and warning/error messages to guide users.
Parallel computations on Linux® servers can be easily executed by clicking a few buttons without fiddly command-line operations. Copy and paste from Microsoft® Excel® to the GUI are supported. Table data such as time-series data measured by experiments can be easily provided as an input.
- *P-Stack is a registered trademark of Mizuho Research & Technologies,Ltd.
- *Microsoft Excel is registered trademark of Microsoft Corporation.
- *Linux is a registered trademark of Linus Torvalds.
- *All Other product and service names mentioned are the trademarks of their respective companies.
PEFC Simulation Software Package P-Stack® - Examples
Example Studies
Example 1: Performance and Internal State of Full-Scale Stack
We investigated the effects of operating and structural conditions on internal states and cell performance of a stack of 100 ~ 300 cells.
Example 2: Effect of Load Fluctuation on Full-Scale Cell
We investigated the effect of load fluctuation on the distributions of current density, water content, and temperature in membrane.
Example 3: Prediction of Durability Performance
We analyzed the effect of channel thickness on carbon corrosion in a cathode catalyst layer.
- *P-Stack is a registered trademark of Mizuho Research & Technologies Institute, Ltd.
PEFC Simulation Software Package P-Stack® - Examples1
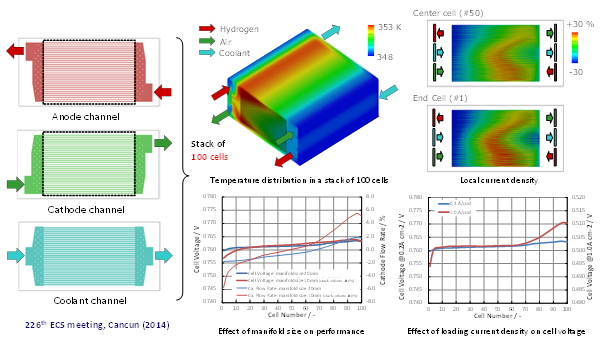
Example 1: Performance and Internal State of Full-Scale Stack
Effect of Operating and Structural Conditions on the Internal state and Cell Performance
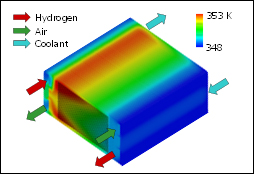
In this example, we investigate the effects of the operating and structural conditions on a stack of 100 cells, whose reaction area is 260 cm2. The figures below show the distributions of the temperature and current density under stationary operating conditions: load current density 0.2 A/cm2, anode utilization 75%, and cathode utilization 50%. This study indicates that manifold downsizing produces an uneven flow rate across cells, while a higher loading current causes an increase of water in the end cell. Both effects result in the performance degradation of the stack system.
- *P-Stack is a registered trademark of Mizuho Research & Technologies, Ltd.
Example 1: Performance and Internal State of Full-Scale Stack
Example 2: Effect of Load Fluctuation on Full-Scale Cell
Example 3: Prediction of Durability Performance
PEFC Simulation Software Package P-Stack® - Examples2
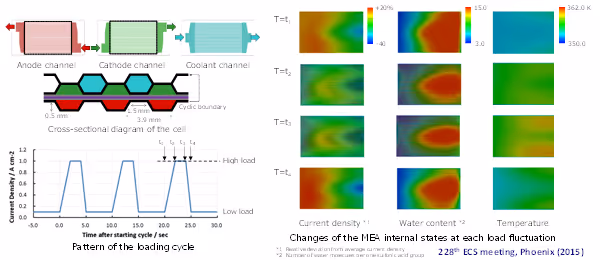
Example 2: Effect of Load Fluctuation on Full-Scale Cell
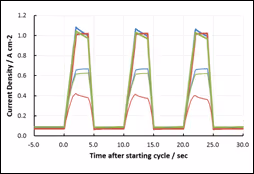
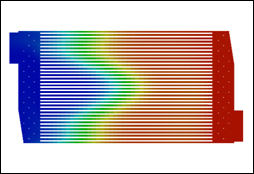
Dry and Wet Cycles of Membrane due to Load Fluctuation
Dry/wet cycle causes mechanical deterioration of electrolyte membranes. The internal states of a full-scale cell were simulated under loading cycles, which imitate actual operating conditions. The distributions of current density, water content, and temperature in a membrane are shown in the right-hand-side figures. A large difference was observed in the water content between channels and ribs (see horizontal stripes in the distributions). High-temperature areas appear in both sides of the coolant outlet at T = t3, and the water content decreases in these areas because of the temperature. As indicated in the example, P-Stack can estimate the area where the dry/wet cycle intensively occurs and predict the area where mechanical deterioration is likely to occur.
- *P-Stack is a registered trademark of Mizuho Research & Technologies, Ltd.
Example 1: Performance and Internal State of Full-Scale Stack
Example 2: Effect of Load Fluctuation on Full-Scale Cell
PEFC Simulation Software Package P-Stack® - Examples3
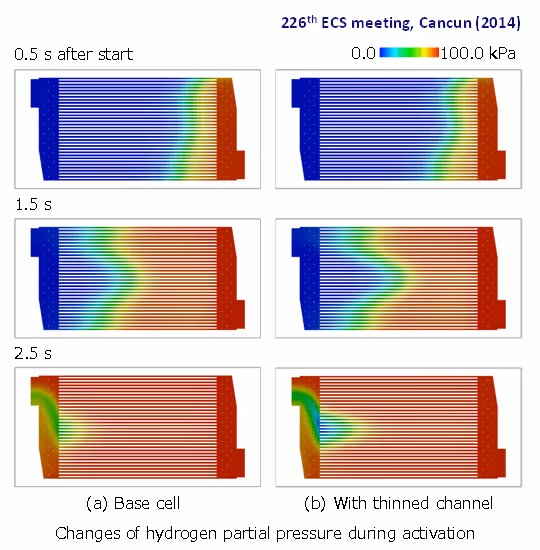
Example 3: Prediction of Durability Performance
Effect of Thinning on Carbon Corrosion
To enhance the durability of polymer electrolyte fuel cells, it is crucial to prevent carbon corrosion during activation. In this example, we analyze the effect of channel thickness on carbon corrosion in a cathode catalyst layer. The right figures compare changes of hydrogen partial pressure distribution for (a) the base cell and (b) the thinner cell whose channels are downsized by 20%. Hydrogen exchange in alnCenter channels occurs slowly because of channel thinning. Consequently, the amount of carbon corrosion in a cathode catalyst layer increases by 10%. This indicates that an even flow distribution is also important in terms of durability.
- *P-Stack is a registered trademark of Mizuho Research & Technologies, Ltd.
Example 1: Performance and Internal State of Full-Scale Stack
Example 2: Effect of Load Fluctuation on Full-Scale Cell
Example 3: Prediction of Durability Performance
PEFC Simulation Software Package P-Stack® - Specifications
Functions
License Fee
System Requirements
In the operation of P-Stack®, users perform pre- and post-processes (e.g. mesh generation and visualizing results) in Windows® PC, while heavy computations (e.g. CFD and power generation simulation) are submit to and executed in Linux® server.
The tables below show system requirements for the Windows PC and the Linux server. The system requirements depend on whether stacks are simulated or only single cells are simulated. The Windows PC and the Linux sever need to be connected in local area network.
(1)Windows PC
(2)Linux Server(For single cell or short stack simulation)
(3)Linux Server(For full stack simulation)
- *P-Stack is a registered trademark of Mizuho Research & Technologies Institute, Ltd.
- *Microsoft is registered trademarks of Microsoft Corporation in the United States and other countries.
- *Linux is a registered trademark of Linus Torvalds.
- *All Other product and service names mentioned are the trademarks of their respective companies.