

Beyond The Obvious
Beyond The Obvious is a source for unique and insightful perspectives on macro, markets and business. We explore possibilities, elucidate ideas, expound on opportunities and engage across stakeholders.
Here you will find Mizuho | Greenhill’s best-in-class thought leadership on industry trends and drivers from subject matter experts, clients and our employees.
Insights
Filter
Industry:
Products:
Other:
Perspectives
Consumer Habits Drive Global M&A
Consumer + Retail, M&A
News
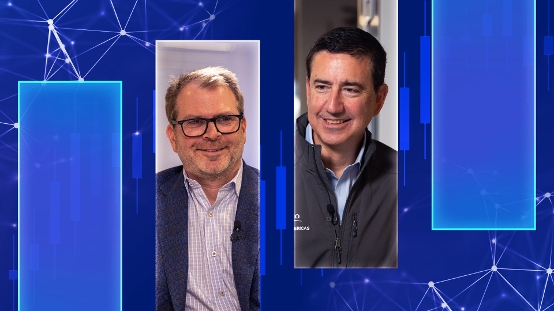
Reuters Article: Mizuho’s Katz sees 'fertile' conditions driving robust M&A market into 2026
M&A

Perspectives
German M&A in a Shifting Europe
M&A

Perspectives
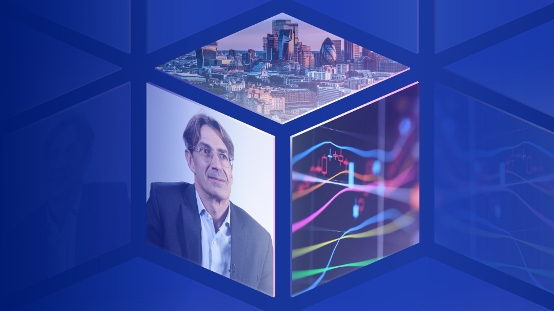
Leading Through the Changing Global Order

News
Michal Katz Discusses the State of Global Dealmaking on Bloomberg’s The Close
M&A, Capital Markets

Perspectives
Balancing Opportunity and Risk in Australian M&A
M&A

Perspectives
The Steady Strength of Nordic M&A
M&A

Perspectives
Drivers of Spanish M&A
M&A
Perspectives
European Dealmaking Landscape
M&A
Perspectives
Q3 2025 Equity Capital Markets: Mid-Year Snapshot
Capital Markets
Perspectives
Q3 2025 Debt Capital Markets: Mid-Summer Update
Capital Markets
News
IFR Article: Greenhill helps Mizuho break into investment banking top 10

Perspectives
The Business of Sports
M&A

Events
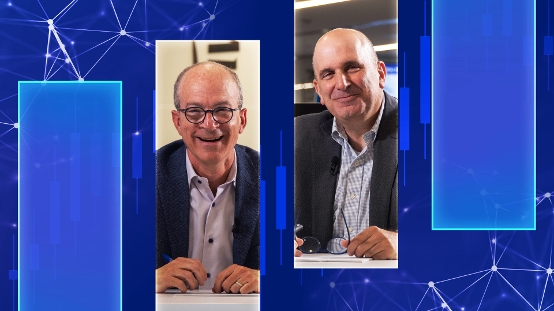
Mizuho Technology Conference Keynote Speaker: Pascal Desroches, Senior Executive Vice President & CFO of AT&T
Technology + Media + Telecom

Events
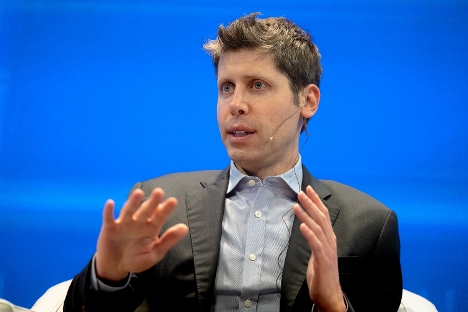
Mizuho Technology Conference Keynote Speaker: Sam Altman, Co-Founder & CEO of OpenAI
Technology + Media + Telecom

Perspectives
Market Confidence Returning
M&A
News
Bloomberg Article: Sam Altman Chats Virtual Companions at Mizuho Tech Conference
Technology + Media + Telecom

Events
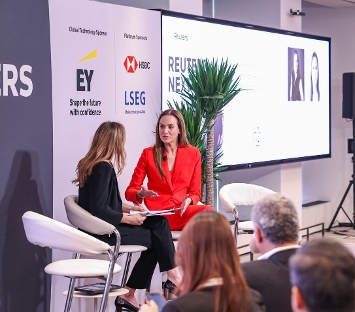
Michal Katz joins "The Boardroom Psyche" panel at the Forbes Iconoclast Summit
Perspectives
Q2 2025 Equity Capital Markets: Rebound in Activity
Capital Markets

People
Storytellers in Business: Rick Fox

Perspectives
Q2 2025 Leveraged Finance: Navigating Volatile Markets
Capital Markets

Perspectives
Q2 2025 Debt Capital Markets: Recalibrating the Market
Capital Markets

News
Michal Katz Shares H2 Dealmaking Predictions on Bloomberg's The Close
M&A, Capital Markets

Perspectives
The Activist Defense Playbook
M&A

Perspectives
Panel Insights: Rating Agencies Outlook on Canadian Energy
Power + Energy + Infrastructure

Events
Mizuho Insights Symposium: A Holistic View of Data Centers

Perspectives
Data Centers: The AI Focal Point

Perspectives
Michal Katz, Head of Investment & Corporate Banking, Mizuho Americas joins Debt Crisis panel at FII Priority Miami

Perspectives
Go Beyond The Obvious

Awards
Mizuho Wins Two House Awards; Recognized by IFR for Other Transactions
Perspectives
Leveraged Finance Market 2025 Outlook
Capital Markets

Awards
Mizuho Recognized for Work on 10 Global Deals
Power + Energy + Infrastructure, Project Finance

Events
Hybrids are having a moment
Capital Markets

Perspectives
Japan’s Economic Renaissance

Perspectives
Understanding the Changing M&A Regulatory Landscape
M&A

Perspectives
Debt Capital Markets Year-End Review and 2025 Outlook
Capital Markets

Perspectives
Sector Outlook 2025

Awards
Mizuho Recognized by the Global Banking & Markets Awards Latin America
Capital Markets

Awards
Mizuho Recognized for Roles in Client Energy and Infrastructure Financings
Power + Energy + Infrastructure, Project Finance

Perspectives
Animal spirits ahead; dealmaking momentum expected to gain force in 2025

Perspectives
Barron's Article: Has China Become the New Japan and Japan the New China?

Perspectives
Fortune.com Article: 5 stalled mega mergers that could get a green light under Trump
M&A

Perspectives
Equity Capital Markets: 2024 Post-Election Outlook
Capital Markets

People
Storytellers in Business, Episode 2: Steve Ricchiuto

Events
Michal Katz, Head of Investment & Corporate Banking, Mizuho Americas joins IPO outlook panel at Saudi Future Investment Initiative

Events
Dealmakers Forum: A Conversation with Tim Ryan, U.S. House of Representatives (2003-2023)
M&A

Perspectives
A Paradigm Shift for Big Tech?
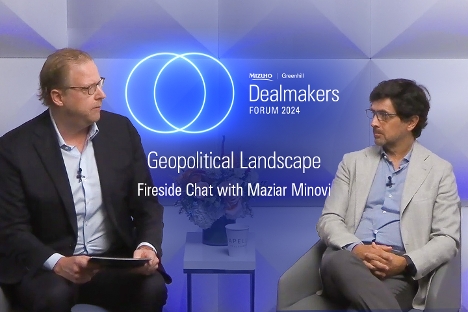
Events
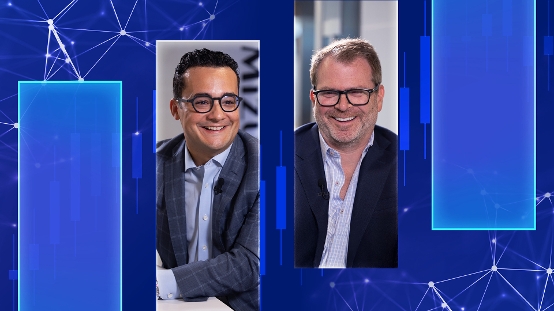
Dealmakers Forum: A Conversation with Maziar Minovi, CEO, Eurasia Group
M&A

Perspectives
Q3 2024 Debt Capital Markets: A Constructive Landscape for Issuers
Capital Markets

Events
Dealmakers Forum: A Conversation with Alex Stern, SVP for Strategy and M&A, IBM
M&A

Awards
Mizuho Named LatinFinance’s Infrastructure Bank of the Year in Central America
Power + Energy + Infrastructure, Project Finance

Events
Dealmakers Forum: A Conversation with Raj Rao, President & COO, Global Infrastructure Partners
M&A

People
Spend your summer with Mizuho | Greenhill

Events
2024 Mizuho | Greenhill Dealmakers Forum: The Return of Dealmaking
M&A

News
Michal Katz Shares M&A and Capital Markets Perspectives on Bloomberg’s The Close
M&A, Capital Markets

Perspectives
M&A Environment in the UK, Europe and Beyond
M&A

Perspectives
Introducing Our Enhanced Insight-Driven Content Hub

People
Storytellers in Business, Episode 1: Barbara Byrne

News
Michal Katz's American Banker Article: The Balance Between Private Credit and Syndicated Loans
Capital Markets

Events
Mizuho Technology Conference Investor Panel: Exit Strategy Alternatives
Technology + Media + Telecom

Perspectives
Welcome to M&A Corner
M&A

Perspectives
Q2 2024 Debt Capital Markets: Mid-Year Macroeconomic Outlook
Capital Markets

Perspectives
Q2 2024 Equity Capital Markets: A Focus on Convertible Bonds
Capital Markets

Perspectives
Q2 2024 Leveraged Finance: A Focus on Leveraged Loans and CLOs
Capital Markets

Events
Featured speaker at Mizuho Technology Conference: Saf Yeboah-Amankwah, Senior Vice President and Chief Strategy Officer at Intel
Technology + Media + Telecom

Events
Mizuho Technology Conference Keynote Speaker: Arvind Krishna, IBM Chairman and CEO
Technology + Media + Telecom

Events
Forbes Iconoclast: Mizuho’s Michal Katz discusses public vs private markets

Perspectives
Impact of the election on M&A dealmaking
M&A

Events
Rating agencies weigh in on Canada’s energy outlook
Power + Energy + Infrastructure

Perspectives
Q1 2024 - Investment Grade DCM
Capital Markets

Perspectives
An analysis of Q1 activity in Equity Capital Markets
Real Estate, Technology + Media + Telecom, Capital Markets

Perspectives
Q1 2024 – Leveraged Finance
Capital Markets

Awards
Mizuho Americas Recognized for Ten IJGlobal Deal of the Year Awards
Power + Energy + Infrastructure, Project Finance

Perspectives
Statins didn’t displace interventional cardiology: A lesson for GLP-1s
Healthcare
Perspectives
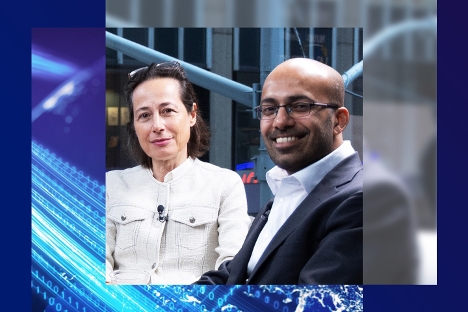
Finance Leaders in Focus: A Conversation with David Neaves
Financial Institutions

Awards
Mizuho Recognized for five IFR Awards

Perspectives
Sector Outlook 2024: Equity Capital Markets
Technology + Media + Telecom, Consumer + Retail, Healthcare, Capital Markets

Awards
Mizuho Americas led transactions recognized by LatinFinance Deal of the Year Awards
Project Finance

Perspectives
Mizuho Investor Survey - 2024 Outlook for IG DCM
Capital Markets
News
A Banner Year for Mizuho
Capital Markets, Project Finance

Perspectives
Cautious optimism for Consumer & Retail - musings from ICR 2024
Consumer + Retail, M&A

Events
Cleared for Conversation: A Fireside Chat with Apollo’s Jim Zelter
Industrials

Awards
Mizuho Americas wins PFI’s Americas Bank of the Year; Recognized with four deal-specific awards
Power + Energy + Infrastructure, Project Finance

Awards
Mizuho Recognized for Funding Essential Energy Projects in the Americas
Power + Energy + Infrastructure, Project Finance

Events
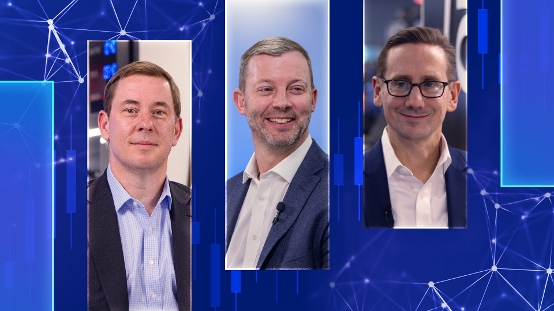
Finance Leaders Forum: A Conversation with Brandy Bergman, Shaival Patel, and Susan Gilbertson
Perspectives
Finance Leaders in Focus: A Conversation with Mark Scheiwer
Consumer + Retail

Events
Finance Leaders Forum: A Conversation with Alex Lynch, Leslie Pfrang and Karen Snow
Capital Markets

Events
Finance Leaders Forum: A Conversation with Kevin Costantino, Seth Mair and Moshe Tomkiewicz
Capital Markets

Events
Finance Leaders Forum: A Conversation with Mizuho’s Moshe Tomkiewicz, Jeb Slowik and Josh Weismer
Capital Markets

Events
Finance Leaders Forum: A Conversation with Gregg Lemos-Stein, Chief Analytical Officer of Corporate Ratings at S&P Global Ratings

Events
Finance Leaders Forum: A Conversation with Joe Dowling, Global Head of BAAM, and Steve Meier, CIO of the New York City Retirement Systems
Alternatives

Perspectives
Capital Markets Q3 2023 Perspectives: Debt Capital Markets and Leveraged Finance
Capital Markets

Awards
Mizuho Americas Recognized for Funding Transformative Projects in Latin America
Power + Energy + Infrastructure, Project Finance
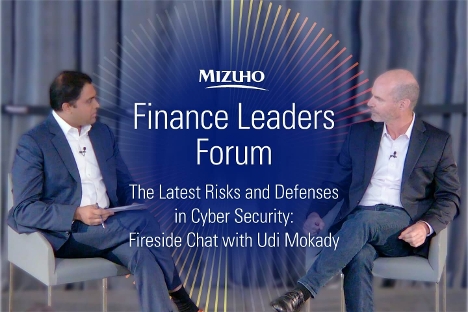
Events
Finance Leaders Forum: A Conversation with Udi Mokady, Founder and Executive Chairman of CyberArk
Technology + Media + Telecom

Events
Finance Leaders Forum: A Conversation with Professor Stephen Kotkin, Kleinheinz Senior Fellow at the Hoover Institution

Events
Finance Leaders Forum: A Conversation with Nicholas Goodman, President and CFO of Brookfield Corporation
Alternatives

Perspectives
Capital Markets Q3 2023 Perspectives: A Focus on ECM
Capital Markets

Events
Finance Leaders Forum: A Conversation with Eric Rosengren, Former President and CEO, Federal Reserve Bank of Boston
Financial Institutions
Events
2023 Mizuho Americas Finance Leaders Forum: Event Highlights

Events
Trailblazers: A Conversation with Prashanth Chandrasekar, CEO of Stack Overflow
Technology + Media + Telecom

Events
Trailblazers: A Conversation with Isabelle Freidheim, Founder and Chairman of the Board of Directors of Athena Technology
Technology + Media + Telecom

Events
Trailblazers: A Conversation with Troy Pospisil, Founder and CEO of Ontra
Technology + Media + Telecom

Events
Trailblazers: A Conversation with Eynat Guez, Co-Founder and CEO of Papaya Global
Technology + Media + Telecom

Events
Trailblazers: A Conversation with Deborah Liu, President and CEO of Ancestry
Technology + Media + Telecom

Events
Trailblazers: A Conversation with Bill Burns, CEO of Zebra Technologies
Technology + Media + Telecom

Events
Trailblazers: A Conversation with Lise Buyer, Founder of Class V Group
Technology + Media + Telecom

Events
Trailblazers: Takeaways from Fortune Brainstorm Tech 2023
Technology + Media + Telecom

Perspectives
Capital Markets Q2 2023 Perspectives: Healthcare in Focus
Healthcare, Capital Markets

News
Mizuho acted as Exclusive Financial Advisor on an acquisition of a $1.8bn open-air retail platform by a joint venture
Real Estate

People
Michal Katz, Head of Investment & Corporate Banking, addresses the Class of 2023 as the keynote speaker at Binghamton University School of Management Graduation
People
In this episode of the Intellectual Curiosity series, a DCM banker discusses what drives Mizuho’s Investment & Corporate Banking presence in Latin America

News
Harnessing the power from within
Real Estate, Project Finance

People
Investment & Corporate Banking Senior Banker Onsite Meeting: Unlocking Potential

Perspectives
Capital Markets Q1 2023 Perspectives
Capital Markets

Events
Mizuho Rating Agency Energy Panel Discussions 2023: Navigating the economic and geopolitical crosscurrents
Power + Energy + Infrastructure

People
Women’s History Month: No Limits

Events
Key themes from SFVegas 2023

Perspectives
Mizuho, your leading bank for convertible bond transactions
Power + Energy + Infrastructure, Capital Markets

Perspectives
The private debt market alternative
Capital Markets
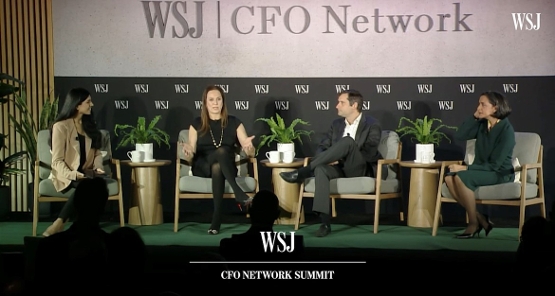
Events
Michal Katz, Head of Investment & Corporate Banking addresses the outlook for financing in uncertain markets at the WSJ CFO Network Summit

Perspectives
The SPAC roller coaster – is a renaissance coming?
Capital Markets

Perspectives
Fanatics CFO Glenn Schiffman discusses the need to put customers - and partners - first, and how collaboration is key to growth
Technology + Media + Telecom

Perspectives
The impact of macro trends on consumer & retail
Consumer + Retail, Capital Markets

Perspectives
Equity capital markets – healthcare: 2022 year in review
Healthcare, Capital Markets

Perspectives
Mizuho Americas Chief Economist Steve Ricchiuto shares his outlook on the economy in 2023
Capital Markets

Perspectives
Equity capital markets – tech, media & telecom: 2022 year in review
Technology + Media + Telecom, Capital Markets

People
In this episode of the Intellectual Curiosity series, an ECM Director discusses what sets Mizuho apart from its competitors

Perspectives
Kevin Davies, Head of Healthcare Investment & Corporate Banking, explores how personalized medicine is shaping the future of healthcare
Healthcare

Perspectives
Precision Decisions: How personalized medicine is shaping the future of healthcare
Healthcare

Perspectives
Michal Katz, Head of Investment & Corporate Banking at Mizuho Americas sits down with Chemi Peres, Managing Partner and Co-Founder of Pitango for Mizuho Conversation with Leaders
Financial Institutions
Perspectives
Mike Comisarow, Head of P&U and Infrastructure Canada, introduces our whitepaper, When Old Economy Becomes New Age
Power + Energy + Infrastructure

Perspectives
Mizuho Investment & Corporate Banking examines the rise of digitalization in infrastructure, including the effects on various sectors, investments being made in the space and what lies ahead for this transformation
Power + Energy + Infrastructure
Perspectives
Mizuho Investment & Corporate Banking explores semiconductor manufacturing, distribution and the seismic shifts and challenges facing the TMT sector today
Technology + Media + Telecom

People
In Mizuho’s series Intellectual Curiosity, hear from a Director in Leveraged Capital Markets explain how Mizuho’s environment and culture is a differentiator.

Perspectives
Peter Juhas, CFO of AerCap, sat down with Andrew Waddington, Managing Director, Industrials at Mizuho Americas to discuss AerCap’s strategy and approach to challenges.
Industrials
Perspectives
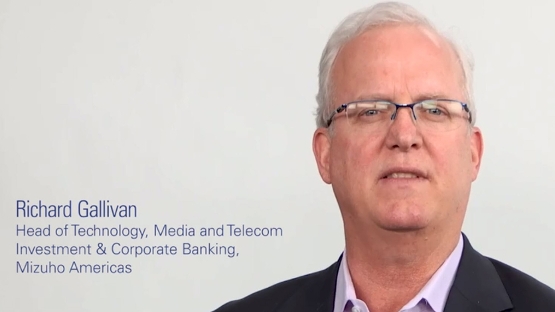
Richard Gallivan, Head of TMT Investment & Corporate Banking introduces our most recent whitepaper, Six Degrees of Separation: Redefining the Semiconductor Supply Chain
Technology + Media + Telecom

Perspectives
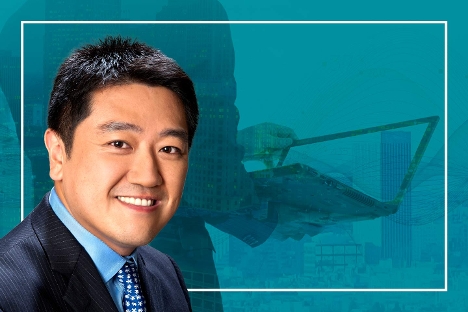
Mark Adams, President and CEO of SGH-Smart Global Holdings, shares thoughts about the digital transformation, the state of the semiconductor space, and his thoughts on the future of technology
Technology + Media + Telecom

Perspectives
Chris Lapointe, CFO of SoFi, sat down with Diane Ferguson, Managing Director and Head of the Financial Institutions Group at Mizuho Americas to discuss SoFi’s mission, growth and differentiator
Financial Institutions, Technology + Media + Telecom
Perspectives
John Hsu, EVP of Corporate Development and Treasurer at AMC Networks, tells us about innovation in media and entertainment, including its influence on consumption and investment
Technology + Media + Telecom

Perspectives
Jodi Eddy, SVP and CIO at Boston Scientific, talks about digital medical devices and the impact technological transformation is having on healthcare
Technology + Media + Telecom, Healthcare

People
In this episode of Intellectual Curiosity, we chat with a Managing Director about Mizuho’s flat structure, entrepreneurial culture and creative approach to client solutions

Perspectives
Abhishek Gupta, CFO of OYO, sat down with Anil Mittal, Managing Director, Industrials at Mizuho Americas to discuss the hospitality industry and managing the challenges of a global business
Real Estate
Perspectives
Linda Mantia, Board member of Ceridian and Director of MindBeacon Holdings shares her ideas about what the next technological trends will be in the healthcare and financial services sector
Financial Institutions, Healthcare

Perspectives
Bhushan Ivaturi, SVP and CIO at Enbridge, discusses the technological trends in energy that are crucial to the sector now, and in the future
Power + Energy + Infrastructure

People
Mizuho’s series, Intellectual Curiosity sits down with one of our senior leaders who describes Mizuho working across borders as collaborative, innovative and exciting

Perspectives
Our whitepaper Digital Horizons explores technological shifts impacting sectors and how business leaders can take advantage of opportunities by looking beyond the obvious
Technology + Media + Telecom

People
Changing of the guard: Four tips for ensuring a successful leadership transition, an article by Michal Katz, Head of Banking Americas - Originally published in Forbes
Events
2023 Mizuho Americas ファイナンスリーダーズフォーラム:イベントハイライト

Perspectives
Hear what Michal Katz, Head of Investment & Corporate Banking at Mizuho Americas says about embracing technological transformation and digital trends
Technology + Media + Telecom