Equity Capital Markets Commentary
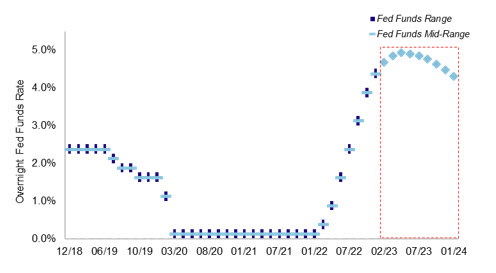
After a decade-long bull market, equities suffered their worst year since the Great Financial Crisis of 2008. Aided by a few extended rallies throughout the year, 2022 did finish outside the top 5 worst performing years in equity market history. Nevertheless, it was an eventful year. For example, the U.S. economy started the year with the Fed Funds rate at effectively 0%, but after rate hikes in almost every meeting in 2022, rates finished the year with a range of 4.25% - 4.50% - the most aggressive change in monetary policy since Paul Volcker's regime in the 1980s. The hawkish Fed policy was in response to inflationary pressures that rose to as high as 9.1% in June. The increase in rates caused the U.S. dollar to significantly appreciate against all major foreign currencies. As a result, corporates were not only facing an increase in input costs, but were also seeing diminished demand for their products. These themes were reflected in several earnings reports throughout the year - leading to missed revenue forecasts and downwardly revised 2022 and 2023 outlooks. As the year transpired, investors started to become more defensive and shifted capital from growth to value stocks. As a result, the Nasdaq finished the year down (33.1%), followed by the S&P 500 down (19.4%) and finally the Dow down (8.8%).
Inflationary Pressures Rose in 2022
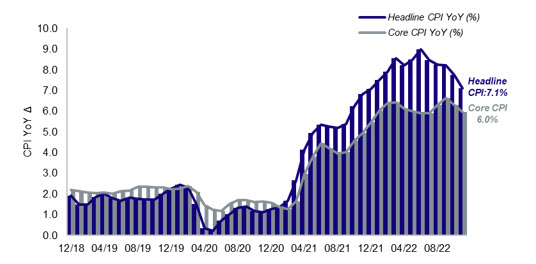
While the Fed Increased Rates to Combat
Due to uncertainty from a macro perspective and poor stock performance, the majority of public and private companies in 2022 avoided issuing equity as most did not think there was much economic benefit to raising equity proceeds. Investors also became more diligent in deploying capital as mounting losses in their portfolios made it difficult for them to add to their existing positions or invest in a new company altogether. As a result, particularly evident in the IPO market, profitable companies (or those with plans to be profitable in the near term) were the types of issuers raising proceeds in the market. This was significantly different from what investors found attractive in 2020 - 2021. Compared to 2021, IPO proceeds were down (93.3%), while secondary offerings (Follow-Ons, Blocks and Converts) were down (67.8%).
Market Performance Summary
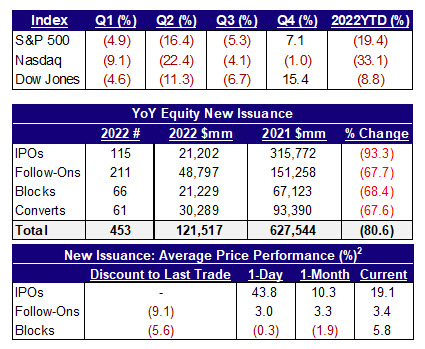
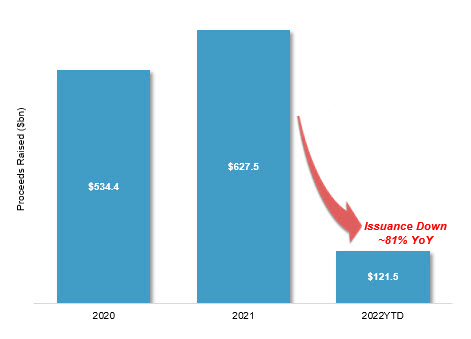
Given the market conditions, issuance proceeds in 2022 were the lowest since 2003. In 2022, there was only $121.5bn of equity issuance - an (80.6%) decrease from 2021. IPOs (ex-SPACs) produced only $7.8bn, or 6.4% of total issuance, and was down (94.9%) from 2021. For the year, there were only two $1bn+ IPOs. This was a stark difference from both 2020 and 2021, which saw 22 and 30 $1bn+ IPOs price, respectively. Follow-On and Block issuance also fell as companies only raised $70.0bn in proceeds - down (67.9%) from 2021. The majority of Follow-Ons were BioTech / Pharma companies taking advantage of better-than-expected trial data or other idiosyncratic catalysts. Companies in a variety of sectors opportunistically engaged in overnight bought deals, while sponsors used the product to monetize their stakes in their portfolio companies - some of which at a loss. Lastly, Convertibles started the year slow, but saw a flurry of issuance towards year-end as the equity-linked product started to become a cheaper financing option relative to raising straight debt and issuers capitalized on the elevated volatility of their stock price.
Issuance Significantly Decreased
Even though there was a substantial decrease in the number of IPOs (ex-SPACs) in 2022 relative to 2021, IPO stock performance was a bright spot. As of year-end, the IPO class of 2021 (ex-China and Hong Kong) had an average and median return of (46.8%) and (60.8%), while the class of 2022 (ex-China and Hong Kong) garnered an average and median return of 19.1% and (3.7%), respectively. As previously noted, this was likely a result of investors valuing profitability over growth as higher interest rates increased the cost of capital for higher growth companies that had come to the market in droves in 2020 - 2021.
Lastly, unlike last year, SPAC IPOs only generated $13.4bn in proceeds - (91.8%) lower than the product's record setting year in 2021. The lowered volume was a result of an already substantially high supply of searching SPACs in the market, all-time high redemptions (~85% average) and its unintended inclusion in the Biden administration's Inflation Reduction Act's excise tax on share buybacks. There were 142 liquidations in 2022 - compared to only two in 2020 and one in 2021. In addition, there were only 102 completed business combinations worth $183.8bn - a (60.5%) decrease from the year prior on the back of high redemption rates and inability to raise additional proceeds in the PIPE market.
TMT Specific Commentary
In 2022, TMT issuers raised $18.5bn, which amounted to 15% of overall issuance proceeds generated during the year. For perspective, this was only 2.9% and 9.7% of total issuance and total TMT issuance in 2021, respectively.
TMT Issuance by Sub Sector4
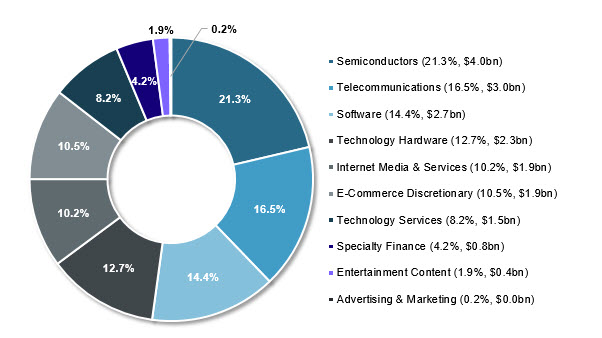
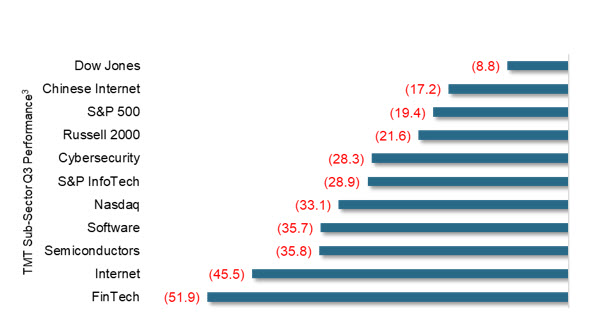
The TMT sector suffered the most from the rising interest rate environment as the majority of sub-sectors significantly underperformed the broader market. As a result, several companies saw valuations halve and even fall below pre-COVID levels. Companies cited a plethora of reasons as to why they missed or slashed forecasts including:
• Expected decrease in IT spending from enterprises
• Limited marketing / advertising budgets
• Export restrictions between the U.S. and China in the Semi space
• Currency headwinds
• Not scaling back hiring and CapEx plans even in light of top-line pressures
• Moderation in consumer transactions and value per transaction coupled with higher delinquencies
These headwinds and many others not only affected companies in the public markets, but also delayed private companies from going public. From 2020 - 2021, there were 155 TMT IPOs1 that priced in the market raising $113.6bn. In 2022, only 3 TMT companies1 went public for $1.4bn - none of which surpassed the $1bn mark.
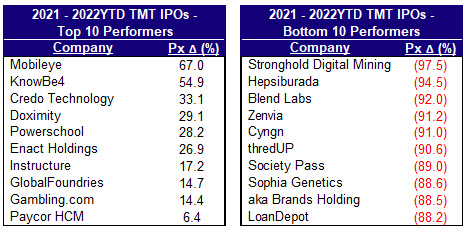
Although only a small subset of companies, the 2022 TMT IPOs (ex-China and Hong Kong) performed significantly better than their 2020 and 2021 counterparts. Despite the market volatility, they had an average and median return of 50.0% and (9.8%), respectively. For example, Mobileye (Nasdaq: MBLY), which went public in the end of October, finished the year 67.0% above its IPO price. This is in comparison to the TMT IPO Class of 2020 - 2021's collective average and median return of (43.2%) and (53.1%).
2021-2022 TMT IPO Performance5
There were a limited number of Follow-On and Block trades in the TMT space largely due to depressed stock prices. For the most part, many were opportunistic as some companies needed to raise cash to finance an M&A deal, while some sponsors monetized existing positions in newly public companies. However, the convertible market did see a healthy amount of TMT companies come to the market which is discerned below.
Looking ahead in 2023, the driving force for equity issuance will continue to be the debate around how high the Fed Funds terminal rate will go. Many are expecting the peak to be met in May and, as a result, 1H23 to be volatile. As inflation decelerates and the Fed provides more dovish commentary, stock prices and valuations will likely appreciate - providing windows for public and private issuers to access the equity capital markets.
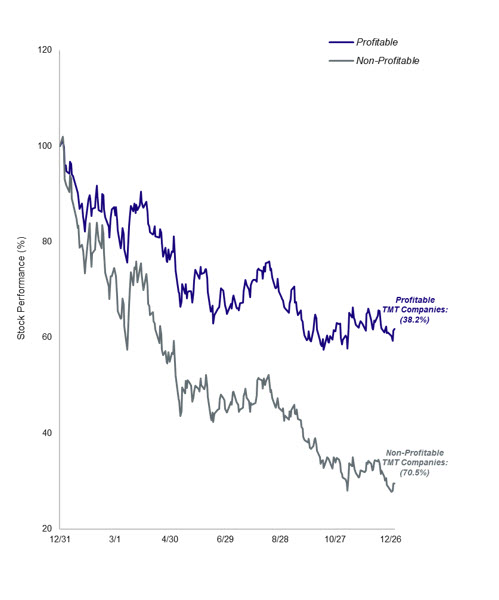
Non-Profitable Tech Underperforms6,7
Investors Rotate out of High Growth7,8
Convertible Market Commentary
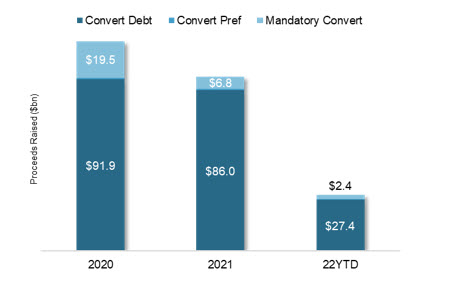
The convertible market only generated $30.3bn in proceeds in 2022 - down (67.6%) from 2021 and (73.0%) from its all-time high in 2020. The market experienced its lowest volume output since 2012.
Convertible Issuance Volumes9
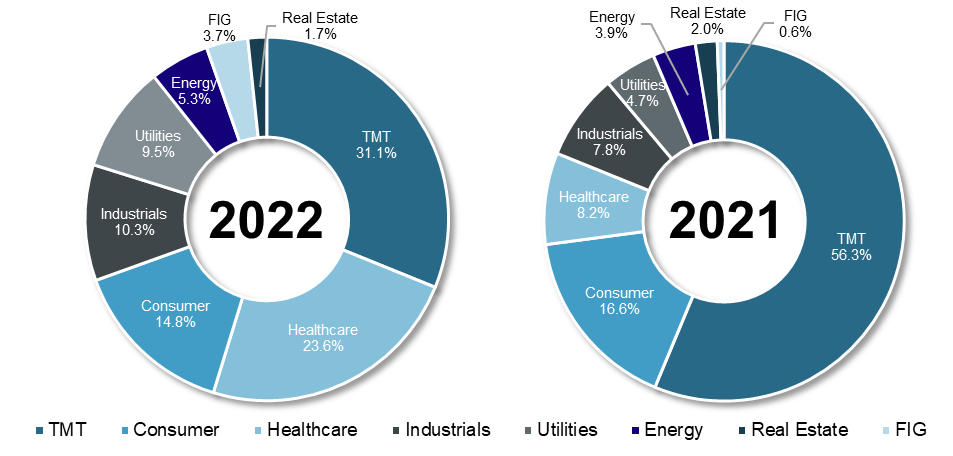
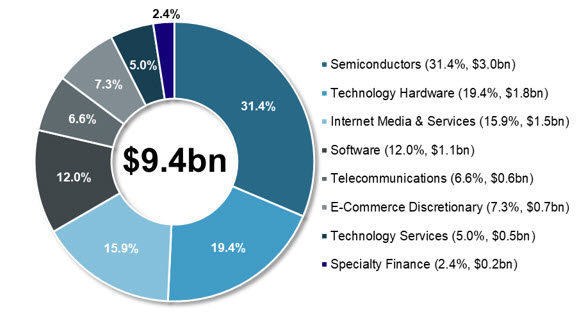
TMT issuers accounted for 29.5% of convertible deals priced and 31.1% of proceeds raised in 2022. With regards to 2021 issuance, 2022 TMT issuers would have only accounted for 11.5% of convertible deals priced and 10.1% of proceeds raised. Semiconductors was the most active TMT subsector in 2022 - representing 31.4% of TMT issuance and 9.8% of overall issuance.
Convertible Issuance by Sector9
As previously noted, convertible terms were attractive compared to straight debt: 16 different TMT issuers raised proceeds at average terms of 2.50% up 32.50% for a 5-year note. The use of the capped-call spread remained relatively high as 35.2% of all TMT issuers utilized the structure to raise the conversion premium to higher levels (i.e., 75% - 100%).
Although conversion premiums have come down and coupons have risen, the equity linked product continued to garner attention from both IG and HY isssuers. As noted in previous sections, investors saw a flurry of issuance come at the end of 4Q22, which could be a precursor for what is in store for 2023. The convertible product should continue to be attractive for both investors and companies in 2023.
TMT Convertible Issuance by Sub-Sector9
Themes and Thoughts
1. How Close is the Fed to its Terminal Rate...
In one of the most aggressive rate tightening campaigns in recent U.S. history, the Fed was able to raise rates from effectively 0% to 4.25% - 4.50% in just nine months. For the majority of 2022, Fed Chair Powell and his committee were essentially the key market catalysts. Heading into 2023, investors are keen on understanding how much further they are willing to increase rates and for how much longer. As of year-end, investors had priced a terminal rate of 4.75% - 5.00% in May of 2023. This will only hold if inflation continues to decelerate and the jobs market shows signs of softening. For the February meeting, investors have priced a 25bps rate hike, but economic data releases between now and then will be the key determinants in deciphering if the Fed is more hawkish or dovish to start 2023.
2. Inflation Gradually Starting to Decelerate...
After reaching a high of 9.1% in June, the U.S. economy has seen CPI gradually fall back to December of 2021 levels. As of November 2022, headline CPI increased 7.1% YoY, while Core CPI increased 6.0% YoY. The Fed has explicitly told the market that once their 2% inflation target is achieved, they will start to consider a more dovish approach. Although inflationary pressures eased, companies have had to adjust not only their 2022 outlooks, but also their 2023 projections as higher input costs have cut into both top and bottom lines. At the same time, higher prices have started to cut into consumer spending habits as more and more Americans are dipping into their savings and spending on credit. As CPI tends to be a laggard, these pricing pressures are likely to continue to be reflected in 4Q22 earnings.
3. How Will China Affect 2023...
The world's second largest economy has been largely cut off from the rest of the world since early 2020 due to their "Covid Zero" Policy. As a result, supply chains and international revenue have suffered mightily for many conglomerates. However, since late November, the Chinese government has quickly rolled back many of its pandemic-related restrictions. This sparked a major rally in Asia as well as for U.S. listed Chinese companies. For example, the KWEB, which tracks all Chinese Internet stocks listed in the U.S., jumped 57.3% over the last two months of the year. Although it would be advantageous if China were to re-open for the rest of the world, many are still concerned that a sharp uptick in cases could result in a regression to Covid protocols. A reversion to "Covid Zero" would likely cause market volatility in 2023.
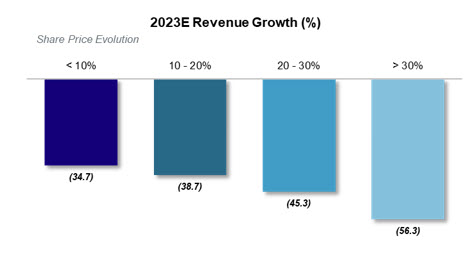
4. Investors Focus on Profitability over Growth...
As we have noted previously in this report, the theme of profitability over growth will likely be a major focus going forward in 2023. From 2016 - 2021, growth stocks outperformed value stocks by 45.5%. After a decade-long bull market came to an end in 2022, investors quickly reversed course and deployed more capital into value stocks. As a result, value outperformed growth by 50.2% in 2022. This was also evident in the TMT sector as profitable companies traded at a 32.0% premium relative to non-profitable companies. From a revenue growth perspective, companies growing 30%+ underperformed companies growing less than 10% by (21.6%), largely due to their respective profitability profiles.
5. When Will the IPO Market Open in 2023...
Many investors expect the IPO market to open in 1H23. However, there are several factors that will need to transpire for that to happen. Most importantly, the market will need to find confidence that the Fed's monetary policy has stabilized which will help moderate volatility. Secondly, economic data will have to show signs of decelerating inflationary pressures coupled with softness in the jobs market. In the current macro backdrop, investors will focus on companies that are profitable or will be profitable shortly after their IPO. They will likely focus on EBITDA and FCF multiples and if the business model can demonstrate resiliency in a recessionary environment. Investors have moved away from the "growth at all costs" mentality and are more concerned about long-term profitability targets.
6. The War in Ukraine Continues...
It has been more than 300 days since Russia conducted a full-scale invasion of Ukraine in late February. The war has resulted in a major refugee crisis and tens of thousands of deaths. Although many experts do not expect the conflict to end in the near term, Ukraine has been resilient in defending its homeland with help from international aid. However, the longer the war goes on, the longer western sanctions on Russia will continue. Some corporations have already pulled personnel and operations stationed in Russia while investors have been barred from investing in Russian assets. Agricultural supply chains have also been affected as Ukraine is a major source of grain and wheat to the world. In 2023, Investors will continue to be wary of further actions by Russia.
Mizuho Highlights
Mizuho ECM served as a bookrunner on 19 equity deals generating $14.9bn in proceed in 2022. Overall, we helped raise over $21bn for our clients by participating in 32 equity or equity-linked transactions.
As a result, we finished 13th in the Equity & Equity-Linked League Table as well as 9th in the Equity-Linked League Table for 2022.
Mizuho acted as a Joint Bookrunner on the largest IPO, largest Follow-On and largest Equity-Linked transactions of 2022:
• CoreBridge Financial's (NYSE: CRBG) $1.68bn IPO
• NextEra Energy's (NYSE: NEE) $2.00bn Equity Unit Offering
• American Tower's (NYSE: AMT) $2.35bn Follow-On
Mizuho also acted as a Joint Bookrunner on the only two major TMT IPOs of 2022:
• Credo Technology's (Nasdaq: CRDO) $230mm IPO
• Mobileye Global's (Nasdaq: MBLY) $990mm IPO
Source: Dealogic, Bloomberg
1. Inclusive of TMT IPOs with deal size >$100mm
2. Performance metrics are for all U.S. listed deals (Ex China and Hong Kong domiciled companies) in 2022 excluding SPACs; Deal size > $25mm
3. Sector performance from 12/31/21 - 12/30/22
4. Deal Size > $25mm
5. Excludes China and Hong Kong domiciled IPOs
6. Profitability of companies is based on CY23E EBITDA; Graph is rebased to 100%
7. U.S. listed Tech companies included have Market Cap >$500mm
8. Revenue growth numbers are reflected as consensus averages
9. Calculated by proceeds raised; Deal Size > $25mm