Financial Data
Consolidated ROE1
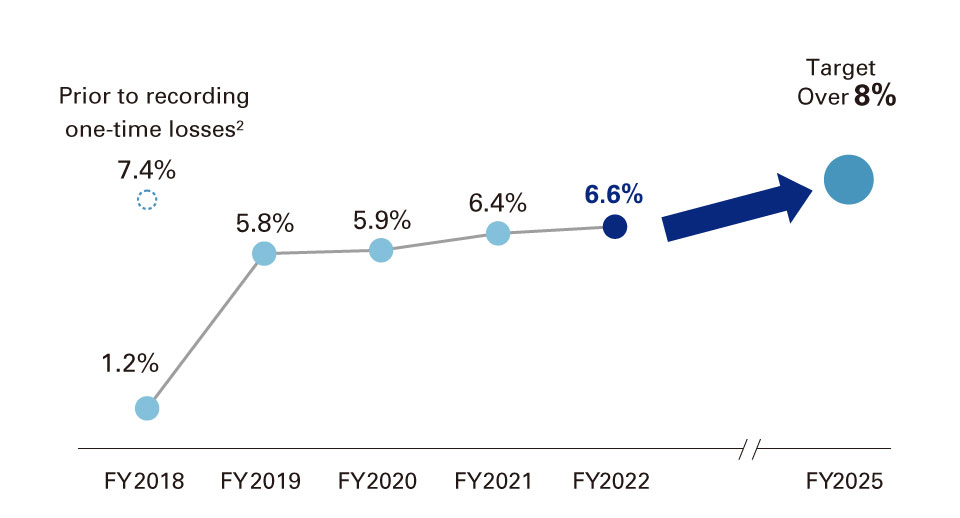
- Excluding Net Unrealized Gains (Losses) on Other Securities
- Prior to reflecting one-time losses in light of structural reforms
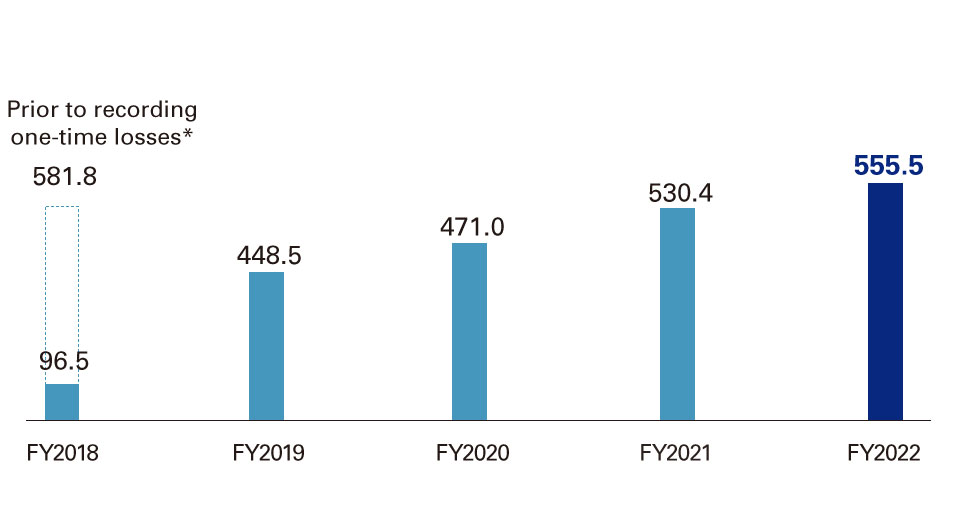
Consolidated Net Business Profits1 (JPY billion)
We recorded consolidated gross profits of JPY2,278.4 billion for fiscal 2022, an increase of JPY25.9 billion from the previous fiscal year. This was mainly due to a steady performance in the customer divisions, especially overseas, although profit declined from realizing losses on foreign bonds in the markets divisions.
General and administrative expenses increased by JPY52.3 billion on a year-on-year basis to JPY1,445.2 billion, mainly due to an increase in expenses as a result of currency fluctuations despite further progress in cost reductions through structural reforms.
As a result, consolidated net business profits decreased by JPY45.9 billion on a year-on-year basis to JPY805.2 billion.
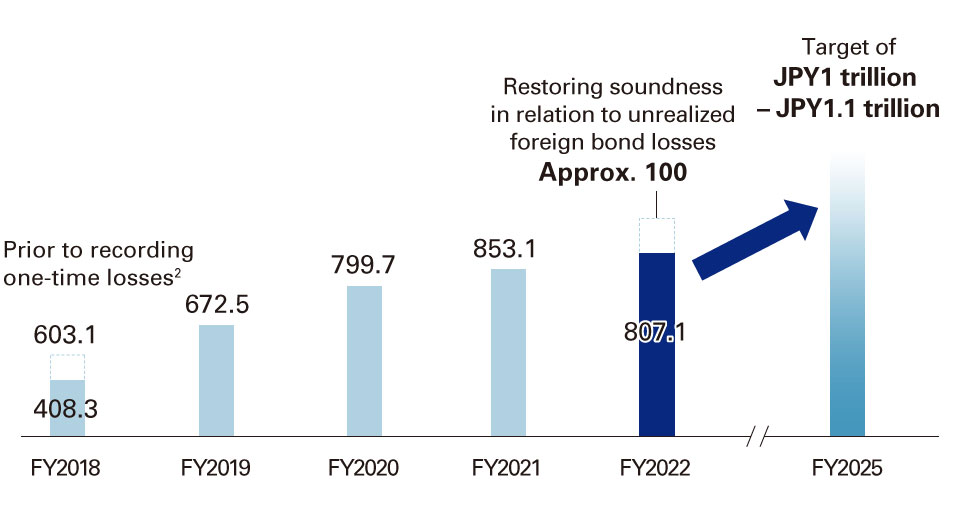
- Includes Net Gains (Losses) related to ETFs (Mizuho Bank and Mizuho Trust & Banking) and Net Gains (Losses) on Operating Investment Securities (Mizuho Securities consolidated)
- Prior to reflecting one-time losses recorded in light of structural reforms
Common Equity Tier 1 (CET1) Capital Ratio*
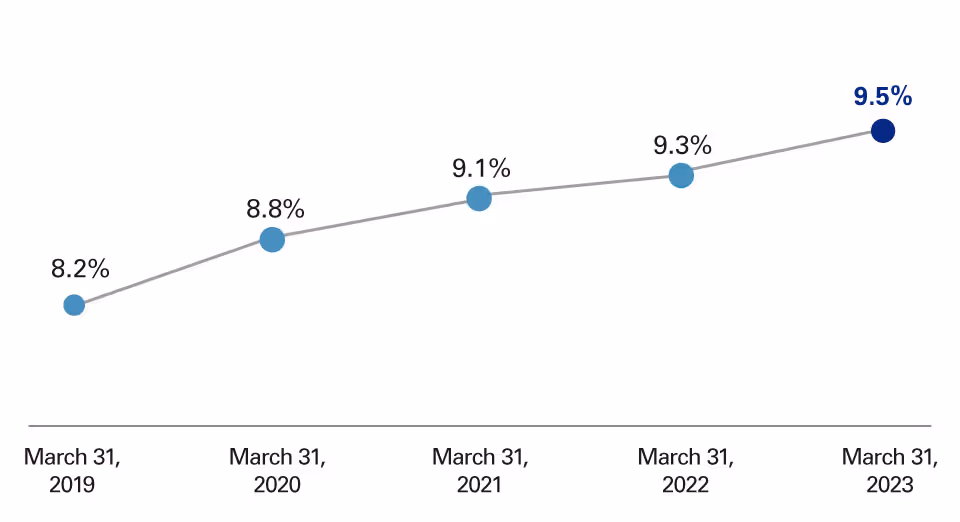
* Basel III finalization fully effective basis, excluding Net Unrealized Gains (Losses) on Other Securities
Cross-shareholdings1 (JPY billion)
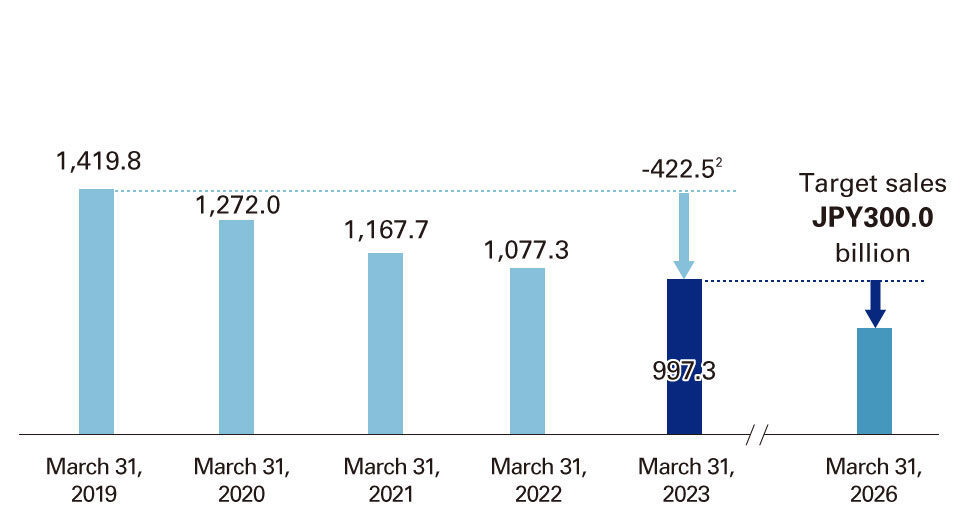
- Acquisition cost basis
- Of which, -JPY383.8 billion from sales
Net Income Attributable to Mizuho Financial Group (JPY billion)
Credit-related costs decreased by JPY145.8 billion on a year-on-year basis to JPY89.3 billion, mainly due to the elimination of a large provision for reserves relating to certain clients recorded in the previous fiscal year.
Net gains (losses) related to stocks increased by JPY130.3 billion on a year-on-year basis to net gains of JPY86.4 billion, mainly due to the elimination of losses on the cancellation of bear funds intended to fix in place unrealized gains on stocks recorded in the previous fiscal year in addition to steady progress in the sale of cross-holding stocks.
As a result, ordinary profits increased by JPY229.7 billion on a year-on-year basis to JPY789.6 billion.
Extraordinary gains (losses) decreased by JPY54.6 billion on a year-on-year basis resulting in net losses of JPY10.6 billion, mainly due to the elimination of a large amount of gains on cancellation of an employee retirement benefit trust recorded in the previous fiscal year.
Income taxes increased by JPY158.1 billion on a year-on-year basis to JPY218.8 billion, partly due to the elimination of the impact of the tax effect of capital optimization of Mizuho Securities as part of financial structure reforms in the previous fiscal year.
As a result, profit attributable to owners of parent increased by JPY25.0 billion on a year-on-year basis to JPY555.5 billion.
* Prior to reflecting one-time losses recorded in light of structural reforms
Cash dividend per share* (JPY)
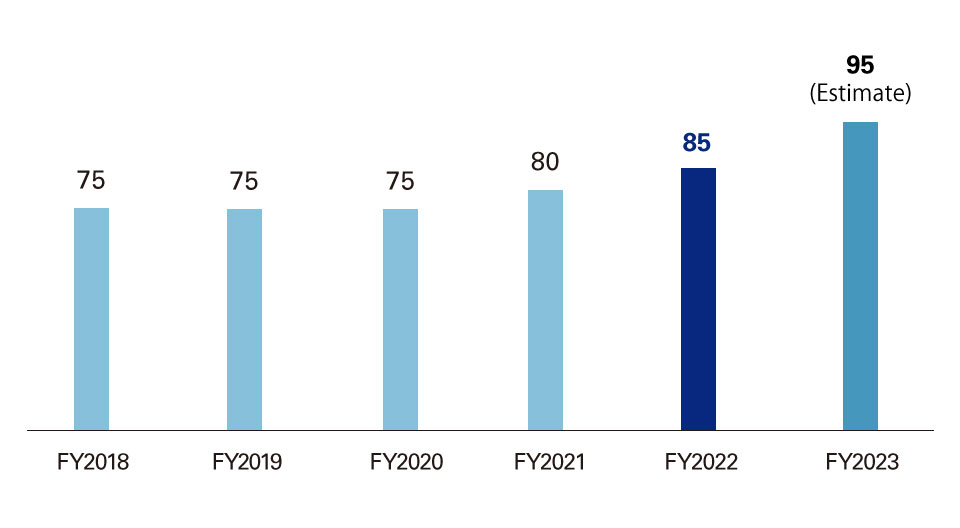
* Reflects the effect of the reverse stock split conducted in October 2020
Non-financial Data
Environment and climate change related
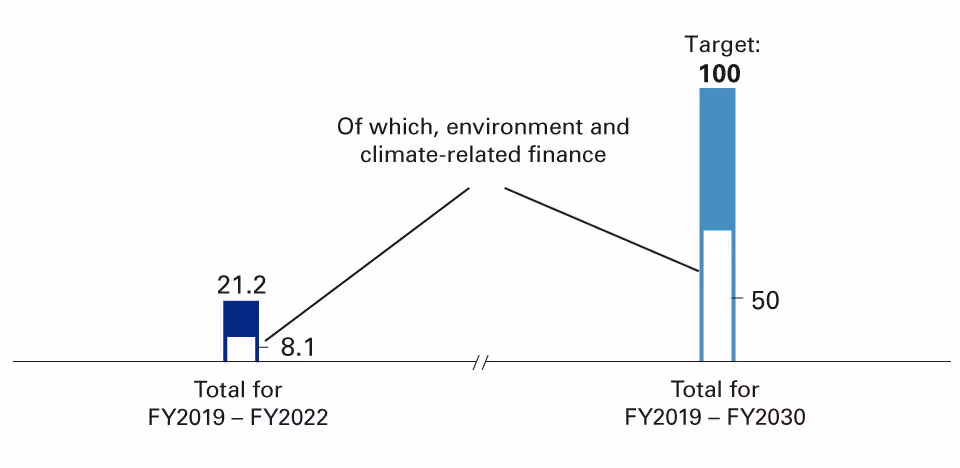
Sustainable finance Environment and climate-related finance (JPY trillion)
Scope 1 and 2 (GHG emissions across the seven group companies1) (ktCO2e)
In relation to Scope 2, progress was made on switching to renewable energy in FY2022.

- Mizuho Financial Group, Mizuho Bank, Mizuho Trust & Banking, Mizuho Securities, Mizuho Research & Technologies2, Asset Management One, and Mizuho Americas (data up to FY2021 are for eight group companies including the former Mizuho Private Wealth Management3).
- Data up to FY2020 combines figures for the former Mizuho Information & Research Institute and former Mizuho Research Institute.
- Company liquidated on March 23, 2022; functions taken over by Mizuho Bank.
Scope 3 (GHG emissions from financing and investment)
Medium-term targets were set for the following three sectors in FY2022 toward achieving net zero GHG emissions (Scope 3) in 2050.
Sector
Target
FY2021 result
Electric power
FY2030
138-232 kgCO2e/MWh
353kgCO2e/MWh
Oil and gas
Scope 1 and 2
FY2030 4.2gCO2e/MJ
6.5gCO2e/MJ
Oil and gas
Scope 3
-12 to -29% (compared to FY2019)
43.2MtCO2e
(-29%)
Thermal coal mining
FY2030 OECD countries: Zero balance
FY2040 Non-OECD countries: Zero balance
1.7MtCO2e
Outstanding credit balance for coal-fired power plants based on our Environmental and Social Management Policy for Financing and Investment Activity
Target
FY2022 result
FY2030: Reduce the FY2019 amount by 50%
FY2040: Zero
21.4% reduction
(JPY235.5 billion)
Exposure to high-risk areas in transition risk sectors
Target
FY2022 result
Reduce over the medium to long term
JPY1.6 trillion
Human capital related
Engagement score1
Target
FY2022 result
FY2025 65%
51%
Inclusion score1
Target
FY2022 result
FY2025 65%
55%
Percentage of management positions outside Japan filled by employees hired outside Japan2
Target
FY2022 result
83%
84%
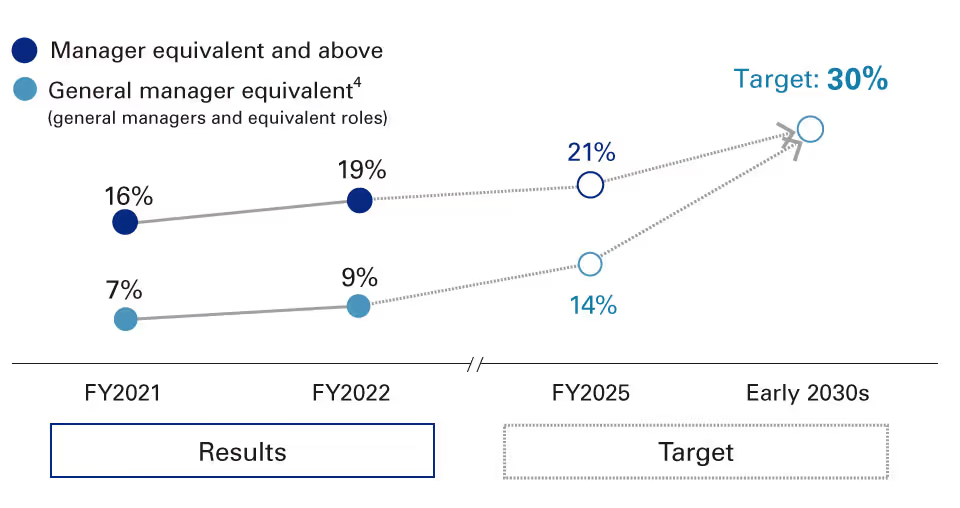
Percentage of management positions filled by women3
- Based on the positive response rate (selection of 4 or 5 on a scale from 1 to 5) for four Staff Survey questions related to engagement and inclusion.
- Total of Mizuho Bank, Mizuho Trust & Banking, and Mizuho Securities
- Japan (Total of Mizuho Financial Group, Mizuho Bank, Mizuho Trust & Banking, Mizuho Securities, and Mizuho Research & Technologies)
- In FY2023, we revised the standards for calculation to align with the medium-term business plan. FY2021 and 2022 result reflect the new standards.
Non-financial Data (appendix)
Corporate governance
Directors
June 2019
June 2020
June 2021
June 2022
June 2023
Number of directors
14
13
13
12
14
Percentage of outside directors
43%
46%
46%
50%
57%
Percentage of director positions filled by women
14%
8%
8%
8%
14%
Average attendance rate for Board of Directors meetings*
100%
100%
100%
100%
-
Nominating Committee
Compensation Committee
Audit Committee
Percentage of outside directors (June 2023)
100%
100%
13
* Fiscal year basis
Human capital
Employees1
FY2018
FY2019
FY2020
FY2021
FY2022
Total number of employees3
58,727
56,225
54,055
51,056
49,068
Employees in Japan
52,607
50,244
48,253
45,667
44,008
Employees hired outside Japan
4,867
4,917
4,728
4,449
4,207
Employees dispatched to our offices from other organizations, and similar.
1,253
1,064
1,074
940
853
Average employee age4
39
40
40
40
40
Average employee length of service4
14
14
15
15
16
Training
FY2018
FY2019
FY2020
FY2021
FY2022
Total number of participants5
/
/
/
/
1,956,513
Training organized by Human Resources Group
48,868
158,448
227,101
354,846
Training hours
/
/
/
/
1,689,113
Training organized by Human Resources Group
1,253
1,064
1,074
940
652,048
Engagement
FY2018
FY2019
FY2020
FY2021
FY2022
Engagement score6
/
/
/
/
51%
Diversity, Equity & Inclusion / Well-being
FY2018
FY2019
FY2020
FY2021
FY2022
Percentage of employees who are female1, 7
57%
57%
57%
57%
57%
Percentage of management positions filled by women
General manager equivalent
5%
5%
6%
7%
9%
Percentage of management positions filled by women
General manager and manager equivalent
14%
15%
16%
16%
19%
Percentage of eligible male employees who take childcare leave9
100%
93%
98%
97%
104%
Percentage of management positions outside Japan filled by employees hired outside Japan10
44%
64%
64%
66%
84%
Inclusion score6
/
/
/
/
55%
Percentage of paid annual leave taken by employees11
75%
77%
70%
76%
78%
- As of March 31. Mizuho Financial Group (including employees seconded to Mizuho Securities), Mizuho Bank, Mizuho Trust & Banking, Mizuho Securities, and Mizuho Research & Technologies.2
- Data up to FY2020 reflects figures for the former Mizuho Information & Research Institute.
- Definition and breakdown have been updated. The figures have been recalculated retroactively based on the new definition.
- Figures are for employees in Japan only, excluding temporary and contract employees.
- In Japan (aggregate for Mizuho Financial Group, Mizuho Bank, Mizuho Trust & Banking, Mizuho Securities, and Mizuho Research & Technologies). Up until FY2021, the scope for training was training organized by the Human Resources Group, but this has been changed as of FY2022 to training organized by all departments, the Human Resources Group included.
- Based on the positive response rate (selection of 4 or 5 on a scale from 1 to 5) for four Staff Survey questions related to engagement and inclusion.
- Figures are for employees in Japan only.
- From FY2022, target, scope, and base date have been changed in conjunction with revision of the medium-term business plan. As of March 31. In Japan, Mizuho Financial Group (including employees seconded to Mizuho Securities), Mizuho Bank, Mizuho Trust & Banking, Mizuho Securities, and Mizuho Research & Technologies.2 Figures for FY2021 and FY2022 are based on the new criteria.
- Due to revisions to relevant laws, FY2022 results have been calculated using legally defined rules (percentages of employees who take childcare leave), while FY2021 results have been calculated using Mizuho's own methods. In Japan, Mizuho Financial Group (including employees seconded to Mizuho Securities), Mizuho Bank, Mizuho Trust & Banking, Mizuho Securities, and Mizuho Research & Technologies.2
- Figures up to FY2018 are for Mizuho Bank only. Figures for FY2019 and later are the aggregates for Mizuho Bank, Mizuho Trust & Banking, and Mizuho Securities. Criteria for management positions changed as of FY2022.
- Figures up to FY2021 are the total of Mizuho Financial Group, Mizuho Bank, Mizuho Trust & Banking, and Mizuho Securities. Mizuho Research & Technologies added as of FY2022.2
Environment
- These data items include all the facilities of seven group companies: Mizuho Financial Group, Mizuho Bank, Mizuho Trust & Banking, Mizuho Securities, Mizuho Research & Technologies3, Asset Management One, and Mizuho Americas (data up to FY2021 are for eight group companies including the former Mizuho Private Wealth Management4. Our FY2022 performance, consolidated subsidiaries included, was 128 ktCO2e (provisional figure).
- The FY2022 figure is provisional.
- Data up to FY2020 combines figures for the former Mizuho Information & Research Institute and former Mizuho Research Institute.
- Company liquidated on March 23, 2022; functions taken over by Mizuho Bank.
- These data items include all the facilities of six group companies: Mizuho Financial Group, Mizuho Bank, Mizuho Trust & Banking, Mizuho Securities, Mizuho Research & Technologies3, and Asset Management One (data up to FY2021 are for seven companies including the former Mizuho Private Wealth Management4).
- Direct and indirect energy consumption converted to megawatt hours.
Sustainable finance and environment and climate-related finance
FY2019
FY2020
FY2021
FY2022
Sustainable finance (JPY trillion) (of which, environment and climate-related finance)
2.4
(1.1)
4.7
(1.5)
6.0
(2.0)
8.1
(3.5)*
* Of which, Mizuho Bank accounts for JPY2.6 trillion and Mizuho Trust & Banking accounts for JPY26.1 billion.
Earnings Outlook
- Consolidated Net Business Profits of JPY 1.07T, Net Profits Attributable to FG of JPY 750.0B
- Aiming for early accomplishment of Medium-term business plan's final year targets (FY25) of Net Business Profits JPY 1-1.1T and Consolidated ROE 8%
Plan for FY 2024 (As of May 15, 2024)
Earnings Plan
Consolidated
(JPY B)
FY 2023
FY 2024
FY 2024
Results
Plan
YoY
Consolidated Net Business Profits1
1,005.8
1,070.0
+64.2
Credit-related Costs
-106.3
-100.0
+6.3
Net Gains (Losses) related to Stocks2
54.7
80.0
+25.3
Ordinary Profits
914.0
1,050.0
+136.0
Net Income Attributable to FG
678.9
750.0
+71.1
2 Banks
(JPY B)
FY 2023
FY 2024
FY 2024
Results
Plan
YoY
Net Business Profits1
650.8
720.0
+69.2
Credit-related Costs
-97.1
-95.0
+2.1
Net Gains (Losses) related to Stocks2
38.2
80.0
+41.8
Ordinary Profits
584.7
715.0
+130.3
Net Income Attributable to FG
401.6
495.0
+93.4
Shareholder return
Cash dividend per share
FY 2023
FY 2024
FY 2024
Results
Plan
YoY
Interim
JPY 50.00
JPY 57.50
+JPY 7.50
Fiscal Year-end
JPY 55.00
JPY 57.50
+JPY 2.50
Annual
JPY 105.00
JPY 115.00
+JPY 10.00
[Assumed financial indicators] 10Y JGB Yield 1.20%. Nikkei 225, JPY 35,150. USD/JPY 135
- Incl. Net Gains (Losses) related to ETFs and others(Consolidated and 2 Banks).
- Excl. Net Gains (Losses) related to ETFs and others(Consolidated and 2 Banks).
This presentation contains statements that constitute forward–looking statements including estimates, forecasts, targets and plans. These statements reflect our current views with respect to future events and are subject to risks, uncertainties and assumptions. Such forward–looking statements do not represent any guarantee of future performance by management and actual results may materially differ.
Further information regarding factors that could affect our financial condition and results of operations is included in our most recent Form 20–F and our report on Form 6–K.
Gross Profits by Segment
FY2022
* Including items which should be eliminated as internal transactions between subsidiaries on a consolidated basis
Chart Generator
Consolidated Financial Results, Consolidated Balance Sheets
Dividend Results
Please note the following:
- This site will not be immediately updated if correction of earnings data and others are announced.
- Frequency of updates may vary due to changes in earnings report format.
The data used within this site is compiled from the earnings announcements.
In the preparation of the various data shown within this site, we make every effort to ensure its accuracy. But despite our best efforts, the possibility for inaccuracy in the data due to reasons beyond our control exists.
For more detailed earnings information please see the Reference Material.
The data contained within this page is provided by PRONEXUS INC.
Powered by ![]()