Corporate Governance System
Corporate Governance Policy
Mizuho Financial Group's corporate governance policy.
Rules and Reports, etc.
Rules and Report, etc. shown below:
Corporate Governance Policy
Mizuho's Corporate Identity, which is composed of Corporate Philosophy, Purpose and The Mizuho Values, serves as the concept that forms the basis of all activities conducted by Mizuho Financial Group.
Under the "Mizuho's Corporate Identity," MHFG forms basic management policies and strategies for its entire group and has each company in our group work together and promote such group strategy. We aim to fulfill our social role and mission by giving due regard to creating value for diverse stakeholders and realizing improved corporate value through continuous and stable corporate growth and contributing to internal and external economic and industrial development and prosperity of society.
MHFG, as a holding company, plays an active role in the management of our group and takes on a planning function with respect to strategies and policies of our group and a controlling function with respect to each company of our group as part of its business management, and establishes a corporate governance system consisting with the Board of Directors at its core, which operates for the benefit of the shareholders, and ensures that self–discipline and accountability of management of our group is fully functioning.
Basic policy regarding its corporate governance system
MHFG has adopted a Company with Three Committees in order to realize the basic policy regarding its corporate governance system.
(1) Secure the effectiveness of corporate governance by ensuring the separation of supervision and management and making supervision of the management such as the execution of duties, etc., by executive officers the primary focus of the Board of Directors.
(2) Make it possible for the management to make swift and flexible decisions and realize expeditious corporate management by the Board of Directors' delegating decisions on business execution to executive officers.
(3) Utilize committees, etc., comprising mainly of outside directors who are independent from the management of Mizuho, and secure transparency and fairness in decision–making processes and the effective supervision of the management.
(4) In the course of designing the organizations, etc., comprising the corporate governance system that realizes matters set out in items 1 through 3, the Company is to actively adopt operations and practices that are recommended at a global level regarding corporate governance as well as compliance with Japanese and foreign laws and regulations as a financial group expanding across the globe.
For your reference, MHFG puts on its website "Corporate Governance Guidelines," which set out the fundamental perspectives regarding corporate governance in Mizuho, and the framework of the corporate governance system and the roles, composition, and operation policies of the Board of Directors, Executive Officers, Nominating Committee, Compensation Committee, and Audit Committee in MHFG as a Company with Three Committees.
The Corporate Governance Report, which sets out the status of MHFG's corporate governance system, has been submitted to the Tokyo Stock Exchange, and it is also put up on the websites of both the Tokyo Stock Exchange and MHFG.
(Related Principle of Corporate Governance Code)
Principle 2.1, Principle 3.1 i), Principle 3.1 ii), General Principle 4
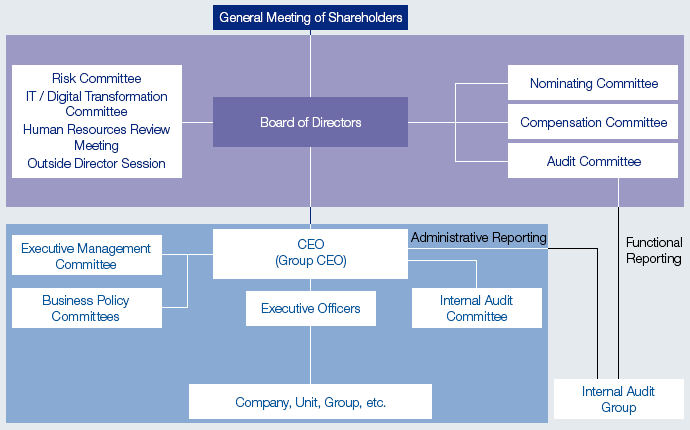
Corporate Governance Structure
Mizuho Financial Group ("MHFG") has adopted a Company with Three Committees in order to realize the basic policy regarding its corporate governance system.
Overview of MHFG's corporate governance structure is shown below.
Regarding the fundamental perspectives, framework and governing policies of MHFG's corporate governance system (Board of Directors, Directors, Nominating Committee, Compensation Committee, Audit Committee, voluntary committee, etc., Mizuho's group governance, and its advisor system), MHFG has established the "Corporate Governance Guidelines" as high–level regulations superseded only by the Articles of Incorporation.
Related Principle of Corporate Governance Code
Principle 3.1 ii)
Supervision
Execution
Internal Audit Group
Accounting Auditor
Advisors System
Relation with Stakeholders
Appropriate Corporate Disclosure
MHFG's Corporate Governance Structure
Supervision
* Following the resolution of the Board of Directors after the Annual General Meeting of Shareholders scheduled for June 2026, the number of Non-executive internal directors is expected to be two, and the number of internal directors who concurrently serves as executive officer is expected to be four.
The Board of Directors and Directors
Role of the Board of Directors and Directors
Role of the Board of Directors
- The main roles of the Board of Directors are making decisions on business execution such as that basic management policy, which are matters to be determined solely by the Board of Directors under laws and regulations, and supervising the execution of duties by directors and executive officers.
- In order to fulfill the roles mentioned above, the Board of Directors shall appropriately establish and supervise the operation of the internal control systems (regarding matters such as risk management, compliance, and internal auditing) and risk governance systems of Mizuho.
- The Board of Directors shall, in principle, delegate to the President & CEO, who is the chief executive officer of Mizuho (Group CEO), decisions on business execution excluding matters to be determined solely by the Board of Directors under laws and regulations, for the purpose of realizing quick and flexible decision–making and expeditious corporate management and strengthening the supervision of executive officers, etc. by the Board of Directors.
Role of Directors
- Each director shall supervise decision–making by the Board of Directors and the execution of duties by other directors and executive officers and execute the duties of the Committees by receiving reports and explanations from the Group CEO and other executive officers or other directors, etc. and asking questions or giving instructions or directions whenever necessary as members of the Board of Directors or appointed members of Committees.
- In addition to taking charge of the duties above as directors, it is expected that outside directors will conduct deliberations and make decisions in the course of making decisions on business execution such as basic management policy and supervising directors and executive officers particularly from the perspective of whether it is possible to realize continuous growth and social contributions by Mizuho from the standpoint of shareholders and other outside stakeholders.
Related Principle of Corporate Governance Code
General Principle 4, Principle 4.1, Supplementary Principles 4.1.1, Principle 4.2, Supplementary Principles 4.3.4, Principle 4.6, Principle 4.7
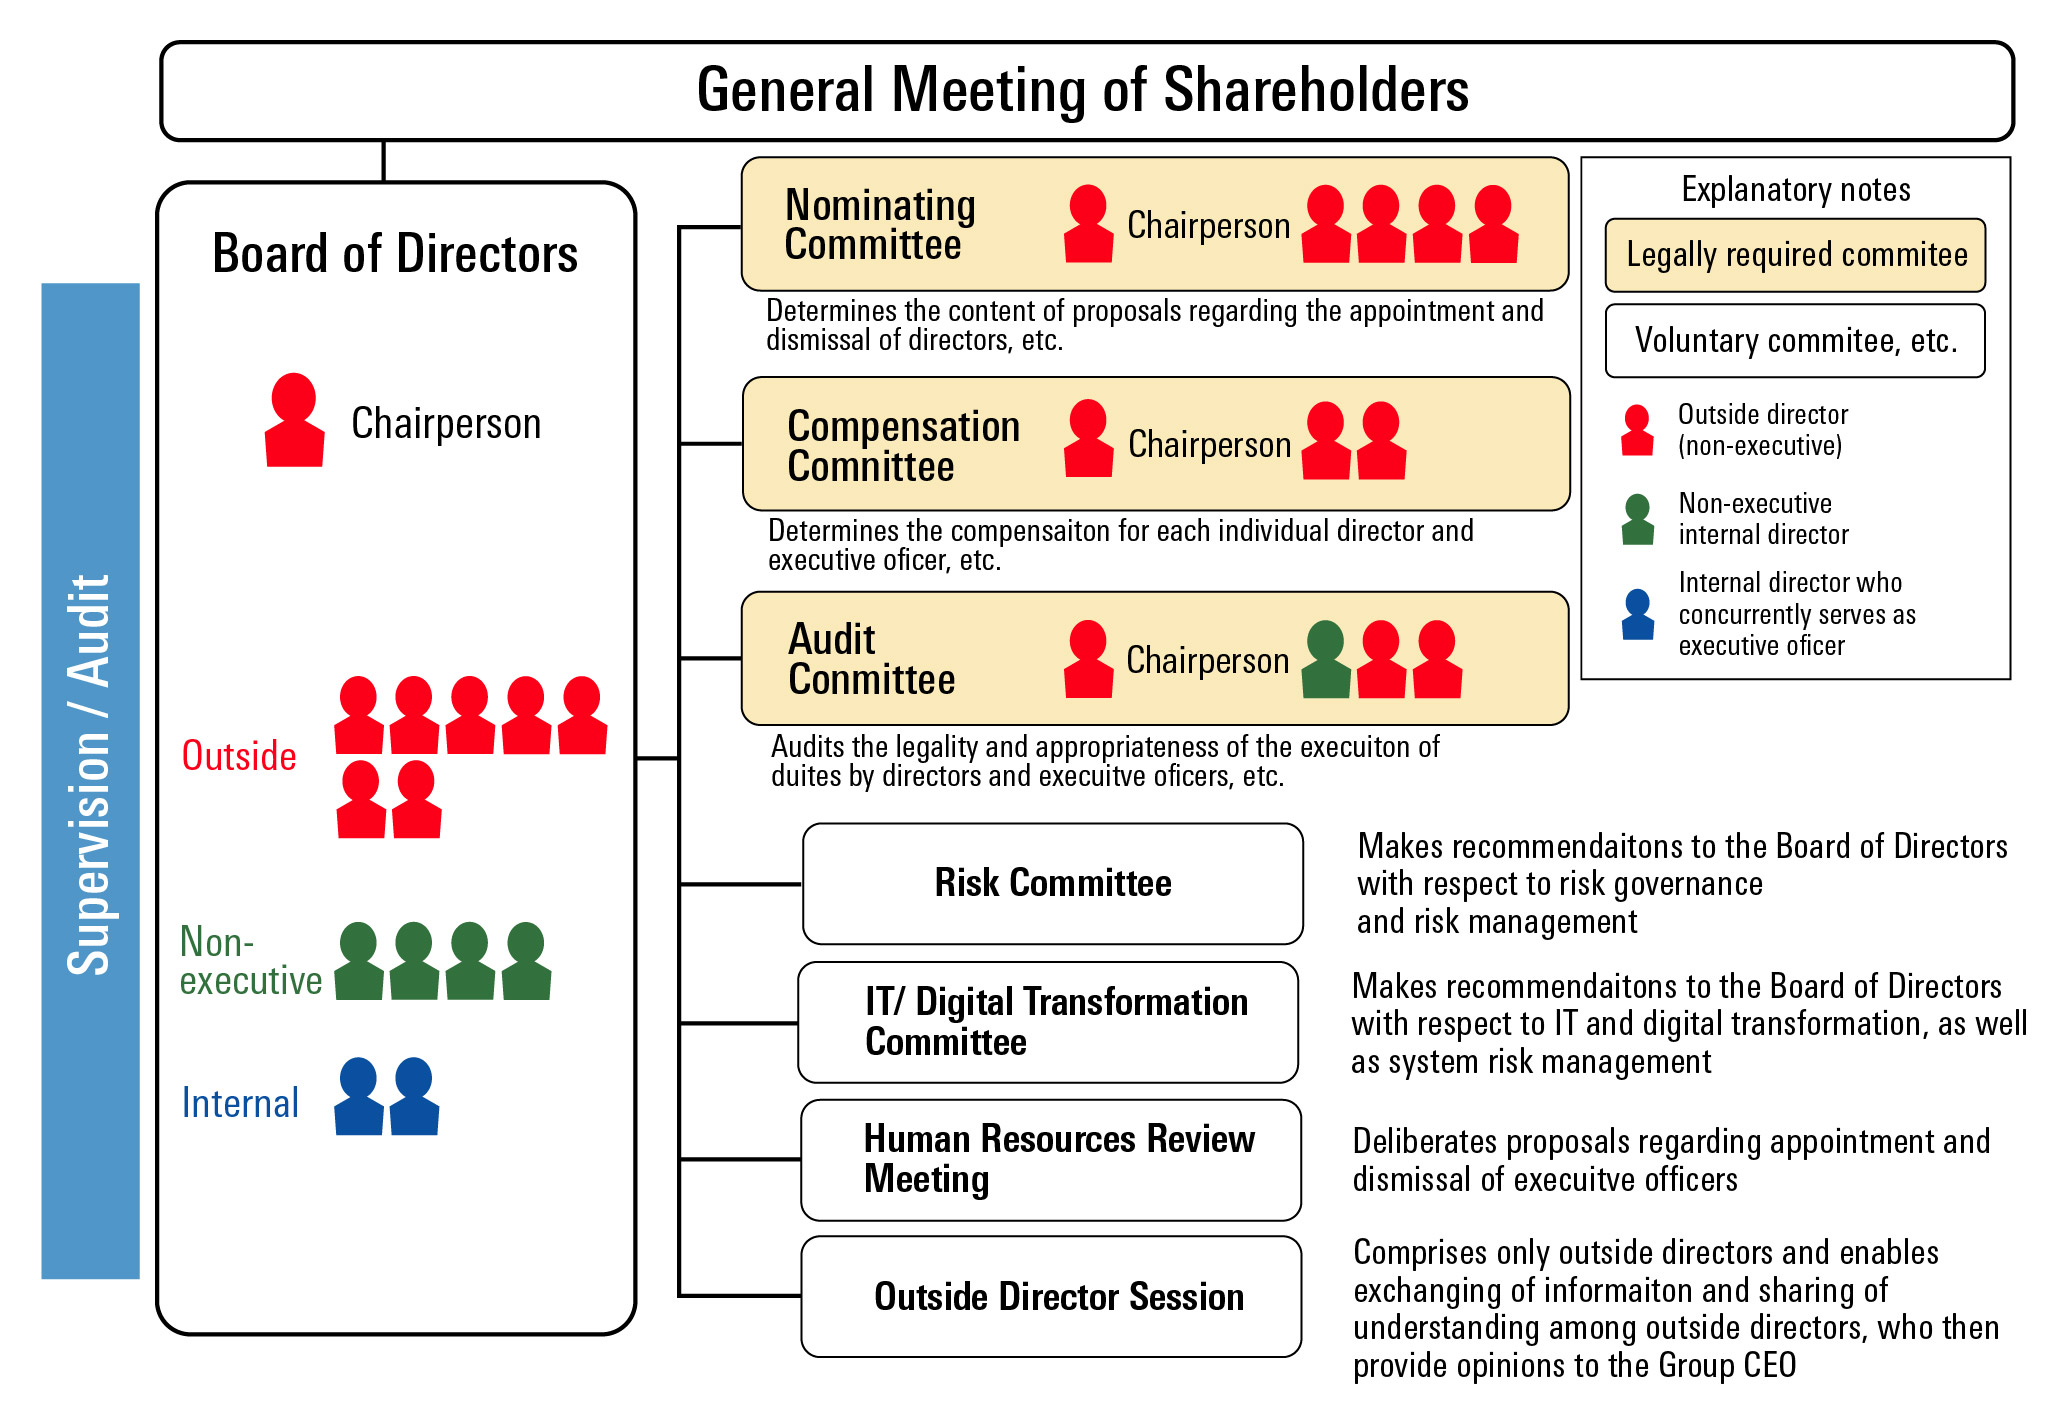
Composition of the Board of Directors
- The Board of Directors shall not have more than fifteen (15) directors, which is the number of directors prescribed under the Articles of Incorporation. In light of the role of the Board of Directors to supervise the management, non–executive directors (outside directors and internal directors who do not concurrently serve as executive officers, managing directors, employees, or executive directors of MHFG or any subsidiary of MHFG) shall comprise a majority of the directors in the Board of Directors, while at least six (6) directors shall be outside directors (to fulfill the "Independence Standards of Outside Directors (PDF/229KB)").
Number of the board members
14
Percentage of Non–Executive Directors
86% (12 out of 14)
* Following the resolution of the Board of Directors after the Annual General Meeting of Shareholders scheduled for June 2026, the percentage of Non-Executive Directors is expected to be 71% (10 out of 14)
Percentage of Outside Directors
57% (8 out of 14)
Chairperson
Takashi Tsukioka (Outside Director (to fulfill the "Independence Standards of Outside Directors"))
* Percentage of female directors: 14.3% / Average tenure: 3.1 years / Average age: 65.4 years
Related Principle of Corporate Governance Code
Principle 4.6, Principle 4.8
Composition of the Board of Directors
Skill matrix of the Board of Directors (Reason for appointment)
Appointment and Dismissal of Directors
- MHFG adopts a Company with Three Committees structure, therefore the Nominating Committee of MHFG determines the contents of proposals regarding the appointment and dismissal of directors of MHFG to be submitted to the general meeting of shareholders.
- Each candidate to be appointed as a director must satisfy the following requirements("Common Requirements").
- The candidate possesses high integrity and deep insight, is highly ethical, and is committed to compliance with laws and regulations.
- The candidate can be expected to apply his or her extensive experience and knowledge in contributing to the continuous and stable corporate growth and improved corporate value of Mizuho.
- The candidate can be expected to contribute to the decision-making function and supervisory function of the Board of Directors.
- The candidate can ensure the time to invest sufficient time for performing his or her duties as a director.
- The candidate satisfies the qualification requirements for directors under laws and regulations.
- Each candidate to be appointed as an outside director must satisfy the following requirements as well as the requirements set out in the preceding paragraph in order to fully exert his or her supervisory function.
- The candidate has the ability to get an overview and understanding of the overall management of Mizuho, the ability to grasp essential issues and risks, and the ability to appropriately interview management and express opinions to and persuade management, etc.
- It is recognized that the candidate is independent from management of Mizuho in light of the Independence Standards of Outside Directors (PDF/397KB).
- Each candidate to be appointed as a director who concurrently serves as an executive officer, such as the Group CEO, must be a person who satisfies Common Requirements in the above and who is familiar with financial businesses and regulations and Mizuho's business model and has the ability to appropriately perform the business management of the Mizuho Group.
- The Nomination Committee selects candidates for directors to ensure that the Board of Directors as a whole possesses the necessary skills to exercise appropriate supervisory functions, including extensive experience and knowledge in the areas of management, risk management and internal control, finance and accounting, finance, human resources and organization, IT and digital, sustainability, and global fields.
- If there are objective and reasonable grounds for determining that a director has become significantly unqualified in light of the requirements set out in the each paragraph, and it is determined that the execution of duties as a director cannot be delegated to that director, then the Nominating Committee shall consider submitting a proposal regarding the dismissal of the director to the general meeting of shareholders.
- With regard to the status of concurrent offices of directors and the reason of appointment of directors, MHFG provides such information on reference materials of the "convocation notice of the ordinary general meeting of shareholders".
Related Principle of Corporate Governance Code
Principle 3.1 iv), Principle 3.1 v), Principle 4.9, Principle 4.11, Supplementary Principles 4.11.1, Supplementary Principles 4.11.2
Director Training
- Our company's directors continuously gather information and enhance their knowledge regarding the business environment and the status of our Group's operations to fulfill their roles and enable the Board of Directors to exercise its supervisory functions. We consistently provide our directors with opportunities to acquire and improve the knowledge necessary to fulfill their expected roles and responsibilities.
- Upon their appointment, we offer opportunities for directors to acquire the necessary knowledge to fulfill their roles and responsibilities, including information on the Companies Act, related laws and regulations, and corporate governance. After their appointment, we continue to provide opportunities tailored to each director as needed. Additionally, for outside directors, we offer various opportunities for information gathering and communication, such as input sessions outside the Board of Directors, exchanges of opinions with officers and employees, and on-site inspections, to deepen their understanding of our Group's business, finances, organization, and business realities.
- The training policy for directors is described in "Corporate Governance Guidelines."
Overview of main initiatives
- "Opportunities to acquire and improve knowledge" in relation to risk management, which directors should be aware of
- "Opportunities to acquire and improve knowledge" to deepen understanding of Mizuho
Related Principle of Corporate Governance Code
Principle 4.14, Supplementary Principles 4.14.1, Supplementary Principles 4.14.2
Operation of the Board of Directors
- The Chairperson of the Board of Directors shall, in principle, be an outside director in light of the role of the Board of Directors to supervise management. Mr. Takashi Tsukioka currently has been the Chairperson of the Board of Directors since June 2025.
- The Board of Directors may, whenever necessary, have executive officers, managing directors and employees of the Company, directors, corporate auditors, executive officers, managing directors and employees of any subsidiary, etc. of the Company, and outside experts, etc. attend meetings of the Board of Directors and request reports or opinions by those people.
- The resolution of the Board of Directors requires the attendance of more than half of the directors who can participate in the decision-making, and is carried out with their majority consent.
- The Board of Directors has delegated decision–making, in principle, to the President & Group CEO for items other than those legally specified as matters to be determined solely by the Board of Directors. The Chairperson of the Board of Directors plays a central role in narrowing down the agendas to enable concentration on truly necessary proposals and, regarding proposals associated with core management issues, the Board of Directors promotes comprehensive discussions of essential points in a free and vigorous manner with the inclusion of high–quality opinions and suggestions from outside directors.
- To ensure the effective and smooth operation of the Board of Directors and each of the Nominating Committee, Compensation Committee and Audit Committee, the Company has established dedicated organizations (Corporate Secretariat and Audit Committee Office) that carries out businesses related to the secretariat of the meeting bodies (such as organizing interested departments related to proposals and explanatory materials, prior explanations to outside directors, and other businesses related to supporting the Chairperson of the Board of Directors and each director). In addition, the Company establishes a position of Deputy Chairperson (Non–Executive Director) in cases where Chairperson is an outside director and where Deputy Chairperson is needed to support the outside director Chairperson.
- The Board of Directors held 14 meetings in the fiscal year ended March 31, 2026. In particular, the Board discussed the direction of medium- to long-term business strategy, status of the initiatives for sustainability, digital transformation, corporate culture transformation, and stable business operations. The average attendance rate was 99%.
Related Principle of Corporate Governance Code
General Principle 4, Principle 4.1, Principle 4.12, Supplementary Principle 4.12.1, Principle 4.13, Supplementary Principle 4.13.1, Supplementary Principle 4.13.2, Supplementary Principle 4.13.3
Evaluating the effectiveness of the Board of Directors
- The Board of Directors shall perform an analysis and evaluation of the effectiveness of the Board of Directors as a whole each year and shall disclose a summary of the results. The Company shall have a third–party evaluation organization perform an evaluation at least once every three years for such self–evaluation.
- The operational policies of the evaluation of the effectiveness of the Board of Directors are stated in Article 9 Paragraph 4 of the "Corporate Governance Guidelines".
- For the summary of the results of the effectiveness evaluation for the fiscal year 2024, please refer to "Corporate Governance Report" [Supplementary Principle 4.11.3].
Nominating Committee
Chairperson
Yoshimitsu Kobayashi
Committee members
Takashi Tsukioka
Kotaro Ohno
Hiromichi Shinohara
Takakazu Uchida
Outside Directors
Roles of the Nominating Committee
- The Nominating Committee comprises mainly outside directors who are sufficiently independent from the management of Mizuho and the role of the Nominating Committee is ensuring objectivity and transparency in the appointment of directors.
- The Nominating Committee executes matters below.
- Determining the contents of proposals regarding the appointment and dismissal of directors of MHFG to be submitted to the general meeting of shareholders
- Exercising the approval rights in MHFG with respect to the appointment and dismissal of directors of each of the Three Core Companies
- Exercising the approval rights in MHFG with respect to the appointment and removal of representative directors and the appointment and removal of directors with special titles of the Three Core Companies
Composition of the Nominating Committee
- The Nominating Committee shall comprise no less than three (3) members. In principle, all members of the Nominating Committee shall be appointed from among the outside directors (or at least Non–Executive Directors). The Chairperson of the Nominating Committee shall be an outside director.
- All members of the Nominating Committee, including the Chairperson, are currently outside directors.
Operation of the Nominating Committee
- Regarding appointment of MHFG's directors, the Three Core Companies' directors and other related matters, The Nominating Committee has its members directly gain an understanding of personnel in connection with candidates to be appointed as directors by attending each type of meeting of members of the Nominating Committee and conducting interviews with management personnel, and operates in light of factors such as the results of evaluations by outside assessment bodies as necessary.
- The Nominating Committee may, whenever necessary, have the Group CEO or other directors, executive officers, managing directors and employees other than members of the Nominating Committee (including directors, corporate auditors, managing directors and employees of the Three Core Companies) and outside experts, etc. attend meetings of the Nominating Committee and request reports and opinions by those people.
- The Nominating Committee held 10 meetings in the fiscal year ended March 31, 2026. The Committee discussed the composition of the Board of Directors of MHFG and the Three Core Companies, aiming to enhance the overall governance of the group, and director nomination and appointment. The average attendance rate was 100%
Related Principle of Corporate Governance Code
Principle 3.1 iv), Supplementary Principle 4.1.3, Principle 4.3, Principle 4.10, Supplementary Principle 4.13.2
Compensation Committee
Chairperson
Takakazu Uchida
Committee members
Yumiko Noda
Yuki Ikuno
Outside Directors
Role of the Compensation Committee
- The Compensation Committee comprises mainly outside directors who are sufficiently independent from the management of Mizuho and the role of the Compensation Committee is to ensure objectivity and transparency in director and executive officer compensation.
- The Compensation Committee executes matters below.
- Determining the basic policy and compensation system for directors and executive officers, and managing directors of MHFG
- Determining the compensation for each individual director and executive officer of MHFG
- Exercising approval rights in MHFG for the basic policy and compensation system for directors and executive officers of the Three Core Companies.
- Exercising approval rights in MHFG for compensation for each individual director of the Three Core Companies
Composition of the Compensation Committee
- The Compensation Committee shall comprise no less than three(3) members. In principle, all members of the Compensation Committee shall be appointed from among the outside directors (or at least Non–Executive Directors). The Chairperson of the Compensation Committee shall be an outside director.
- All members of the Compensation Committee, including the Chairperson, are currently outside directors.
Operation of the Compensation Committee
- The basic policy of compensation for directors, executive officers, and managing directors contains compliance with domestic and overseas regulations and guidelines, etc. pertaining to compensation for directors, executive officers, and managing directors and the realization of the compensation system corresponding to the role and responsibility to be carried out by directors, executive officers, and managing directors in light of factors such as the medium– to long–term results of the Company, examples of other companies in the same industry as well as economic and social circumstances.
- The Compensation Committee may, whenever necessary, have the Group CEO or other directors, executive officers, managing directors and employees other than members of the Compensation Committee (including directors, corporate auditors, managing directors and employees of the Three Core Companies) and outside experts, etc. attend meetings of the Compensation Committee and request reports and opinions by those people.
- The Compensation Committee held 7 meetings in the fiscal year ended March 31, 2026. The Committee discussed on the determination of individual compensation for directors and executive officers, the evaluation of incentive compensation for fiscal 2024, verification and review of our group’s executive compensation system in light of our group's management environment and domestic and international economic trends, and the verification and review of compensation levels in light of market research and other factors. The average attendance rate was 100%.
Mizuho Financial Group Basic Policy for Executive Compensation (PDF/305KB)
Related Principle of Corporate Governance Code
Principle 3.1 iii), Principle 4.2, Supplementary Principle 4.2.1, Supplementary Principle 4.13.2
Audit Committee
Chairperson
Kotaro Ohno
Takakazu Uchida
Committee members
Takakazu Uchida
Masahiko Tezuka
Hisaaki Hirama
Outside Director
Outside Director
Internal Non–Executive Director
Role of the Audit Committee
- The Audit Committee shall audit the legality and appropriateness of the execution of duties by directors and executive officers.
- When conducting audits, the Audit Committee shall, whenever necessary, gather information based on its right to collect reports and investigate business property.
Related Principle of Corporate Governance Code
Principle 4.4
Composition of the Audit Committee and Appointment of Members
- The Audit Committee shall comprise no less than three (3) members who are Non–Executive Directors, and the majority of those members shall be outside directors.
- Given that as a financial institution, it is essential for the Company to ensure the effectiveness of the activities of the Audit Committee, and that it is necessary for the Audit Committee to gather information through internal directors who are familiar with financial businesses and regulations, share information among the Audit Committee, and to have sufficient coordination with internal control departments, the Company shall in principle appoint one or two Non–Executive Directors who are internal directors as full–time members of the Audit Committee. As for the members of the Audit Committee other than the full–time members of the Audit Committee, the Company shall appoint outside directors.
- MHFG listed its American Depositary Receipts on the NYSE, therefore the members of the Audit Committee shall meet independence requirements under the U.S. securities laws and regulations as may from time to time be applicable to the Company. Further, at least one member of the Audit Committee shall be a "financial expert" as defined under U.S. law.
- The Chairperson of the Audit Committee is currently outside director.
Related Principle of Corporate Governance Code
Supplementary Principle 4.4.1, Principle 4.11
Operation of the Audit Committee
- The Audit Committee shall play a role in the supervisory function of the Board of Directors and shall audit the execution of duties by the directors and the executive officers.
- The Audit Committee shall monitor and inspect the establishment and management of the internal control system of MHFG and its subsidiaries.
- The Audit Committee shall monitor and inspect the condition of the execution of duties with respect to corporate management of subsidiaries, etc. by executive officers.
- The Audit Committee determines the contents of proposals regarding the appointment, dismissal and non–reappointment of accounting auditors to be submitted to the general meeting of shareholders.
- The Audit Committee adopts resolutions regarding the approval of the basic policy for internal audits, the basic internal audit plan, as well as the Internal Audit Group's budget, the entrustment and remuneration of the Group CAE, and the assignment of the General Manager of the Internal Audit Group.
- The Audit Committee shall execute its duties through effective coordination with internal control departments, etc. based on the establishment and management of an internal control system in MHFG and its subsidiaries.
- The Audit Committee may, whenever necessary, have directors, executive officers, managing directors and employees of the Company and directors, corporate auditors, managing directors and employees of subsidiaries, etc. of the Company other than members of the Audit Committee, accounting auditors, and outside experts, etc. attend meetings of the Audit Committee and request reports and opinions by those people.
- The Audit Committee held 16 meetings in the fiscal year ended March 31, 2026. In particular, the Committee confirmed the effectiveness of the Structure for Ensuring Appropriate Conduct of Operations (internal control system) and provided relevant opinions. Moreover, the Committee monitored the progress of key strategies in the executive departments, recognition of issues, and efforts to strengthen internal management systems with priority. The average attendance rate was 100%.
Related Principle of Corporate Governance Code
Principle 4.13, Supplementary Principle 4.13.1, Supplementary Principle 4.13.2, Supplementary Principle 4.13.3
MHFG has established committees and other organizations on a voluntary basis in addition to the above legally–required three committees as set forth.
Risk Committee
Chairperson
Hisaaki Hirama
Internal Non–Executive Director
Committee members
Yumiko Noda
Yuki Ikuno
Rintaro Tamaki
Hiroshi Naka
Outside Director
Outside Director
External Expert
External Expert
- The Risk Committee, as an advisory body to the Board of Directors, shall make recommendations to the Board of Directors regarding supervision and decisions relating to risk governance and supervision of matters such as the status of risk management.
- The Risk Committee shall, in principle, comprise no less than three (3) members who shall be Non–Executive Directors or outside experts.
- The Risk Committee held 7 meetings in the fiscal year ended March 31, 2026. In particular, the Committee discussed the selection of top risks, the operational status of the risk appetite framework, the status of comprehensive risk management, the status of sustainability initiatives and business and risk awareness in overseas regions. The average attendance rate was 94%.
Related Principle of Corporate Governance Code
Principle 4.10
IT / Digital Transformation Committee
Chairperson
Hiromichi Shinohara
Outside Director
Committee members
Masahiko Tezuka
Hisaaki Hirama
Masatsugu Shimono
Keiji Kojima
Outside Director
Internal Non-Executive Director
External Expert
External Expert
- The IT / Digital Transformation Committee, as an advisory body to the Board of Directors, shall make recommendations to the Board of Directors regarding supervision and decisions related to IT and digital transformation and supervision of the status of IT risk management.
- The IT / Digital Transformation Committee shall, in principle, comprise no less than three (3) members who shall be Non-Executive Directors or outside experts.
- The IT / Digital Transformation Committee held 6 meetings in the fiscal year ended March 31, 2026. In particular, the Committee discussed the status of the initiatives for IT and digital transformation, the status of the initiatives for stable business operations, matters regarding material IT project, and IT risk management and cybersecurity risk management. The average attendance rate was 96%.
Related Principle of Corporate Governance Code
Principle 4.10
Human Resources Review Meeting
- The Human Resources Review Meeting shall deliberate over plans for the appointment and dismissal of, and commissioning of MHFG's executive officers as defined in the Companies Act and plans for the appointment and removal of MHFG's executive officers as defined in the Companies Act with special titles, such plans to be decided upon by the Board of Directors.
- The Human Resources Review Meeting shall comprise the members of the Nominating Committee and the Group CEO in order to ensure transparency and fairness in the appointment of executive officers and specialist officers.
- The Human Resources Review Meeting held 7 times in the fiscal year ended March 31, 2026. In particular, the Meeting discussed the succession of key executives, and personnel changes for executive line officers in the fiscal year ending March 31, 2027. The average attendance rate was 100%.
Related Principle of Corporate Governance Code
Principle 3.1 iv), Principle 4.3, Supplementary Principle 4.1.3, Supplementary Principle 4.3.1, Supplementary Principle 4.3.2, Supplementary Principle 4.3.3, Principle 4.10
Outside Director Session
- The Outside Director Session shall be to exchange information and share understanding among only the outside directors and to provide objective and candid opinions to the management based on the outside directors' perspectives as outsiders as necessary.
- The Outside Director Session held 3 meetings in the fiscal year ended March 31, 2025. In particular, outside directors exchanged opinions each time with the outside directors of the Three Core Companies on permeation of corporate identity, transformation of corporate culture, focus areas of the banking, trust, and securities businesses, business transformation and global governance. The average attendance rate was 92%.
Related Principle of Corporate Governance Code
Supplementary Principle 4.8.1, Supplementary Principle 4.8.2, Principle 4.10, Principle 4.11, Supplementary Principle 4.11.3
Execution
Corporate Executives (i.e., executive officers as defined in the Companies Act)
Roles of Corporate Executives
- Corporate Executives of MHFG take charge making decisions on business execution delegated by a resolution of the Board of Directors and implementing the business execution of MHFG.
Appointment and Dismissal of Corporate Executives
- In the course of appointing Corporate Executives, the Board of Directors shall appoint the Group CEO and, in principle, can select from among the heads of in-house companies and units, and the Group CxOs, taking into account deliberations by the Human Resources Review Meeting and based on the policy that it is necessary to appoint as Corporate Executives people who make decisions on business execution delegated by the Board of Directors as managers of the Company, who assume a comprehensive role of business execution, and who satisfy the following requirements.
- The candidate possesses high integrity and deep insight, is highly ethical, and is committed to compliance with laws and regulations.
- The candidate has the ability to execute his or her duties based on his or her extensive experience and knowledge as well as a superior business sense and can be expected to contribute to the continuous and stable corporate growth and improved corporate value of Mizuho.
- The candidate satisfies the qualification requirements for Corporate Executives under laws and regulations.
- If there are objective and reasonable grounds for determining that a Corporate Executive has become significantly unqualified in light of the requirements set out in the above paragraph, and it is determined that the execution of duties as a Corporate Executive cannot be delegated to that Corporate Executive, then the Board of Directors shall consider dismissing the Corporate Executive, taking into account deliberations by the Human Resources Review Committee.
- With regard to the status of concurrent offices of Corporate Executives and the reason of appointment of Corporate Executives, MHFG provides such information on reference materials of the "convocation notice of the ordinary general meeting of shareholders".
Operation by Corporate Executives
- The President & CEO shall oversee the business of the Company as the Group CEO. The Executive Management Committee was established to serve as an advisory body for the President & CEO and discusses important matters concerning the execution of business operations as necessary.
Succession Planning
The Group CEO shall invest sufficient time and resources in developing candidates for successors to the Group CEO and other executive officers and shall report to the Nominating Committee and the Human Resources Review Meeting at least once a year on the status of the development and operation of plans for such successors.
Related Principle of Corporate Governance Code
Principle 3.1 iv), v), Supplementary Principles 4.1.3, Principle 4.3, Supplementary Principles 4.3.1, 4.3.2, 4.3.3
Internal Audit Group
Internal Audit Group
- Under the supervision of the Board of Directors and the Audit Committee, the Internal Audit Group is independent from the departments it audits. The Internal Audit Group conducts internal audits of MHFG in accordance with the basic policy and the basic audit plan determined by the Board of Directors and the Audit Committee, and monitors and manages the status of internal audit operations at our major group companies in a centralized manner by verifying the internal audits and internal control systems of each company based on reports submitted by major group companies on the results of internal audits and the status of follow-up on problems identified.
- Based on the basic policy for internal audits, the Group CAE manages matters related to the planning and operation of internal audits, and reports to the Board of Directors, etc. on the status of the operations, regularly and as needed. Specifically, the Group CAE reports functionally to the Board of Directors and the Audit Committee on important matters related to internal audits. In addition, the Group CAE reports on the progress and results of individual audits and plans to the Audit Committee, and responds to requests for investigations as needed, or follows specific instructions.
- Also, as the person in charge of internal audit, the Group CAE reports administratively on the status of internal audits operation management to the Group CEO directly or through the Internal Audit Committee.
Accounting Auditor
- The Audit Committee establishes standards for proper evaluation of the accounting auditors, and maintains the procedures regarding the appointment and dismissal of the accounting auditors of MHFG according to the standard.
- MHFG endeavors to give the accounting auditors adequate time to ensure high quality audits, ensure the accounting auditors have the chance to interview senior management, including the CEO and the CFO, and ensure coordination between the Audit Committee, including outside directors, and the Internal Audit Group.
Related Principle of Corporate Governance Code
Principle 3.2, Supplementary Principle 3.2.1, Supplementary Principle 3.2.2
Advisors system
- The Company does not have a consultant (sodanyaku) system, but there are some cases where former representative directors and presidents, etc., are appointed as senior advisors.
- Advisors shall participate in the activities of economic associations and social contribution programs and the like in order to fulfill the social responsibilities and contribute to the development of the Company and the Mizuho Group. Advisors shall not participate in the management of the Company or the Mizuho Group.
- Outside directors are involved in the appointment and removal of and compensation for advisors, and the advisors system in general.
- For other details, refer to "Corporate Governance Guidelines" and "Corporate Governance Report".
Relation with Stakeholders
"The Mizuho Code of Conduct,” which is standards for implementing "Mizuho's Corporate Identity," stipulates Mizuho’s Basic Stance to serve as infrastructure for the economy and society and our stance towards our stakeholders (our customers, the economy and society, and our employees).
Related Principle of Corporate Governance Code
General Principle 1, General Principle 2, Principle 2.1, Principle 2.2, Supplementary Principle 2.2.1, Principle 4.5
Relation with Shareholders
Relation with Shareholders
Mizuho is committed to an open form of management that emphasizes proactive communication with shareholders and investors.
To earn the satisfaction and trust of its Shareholders, Mizuho will make every effort to improve general meetings of shareholders.
Shareholders and the general meeting of shareholders
- In light of shareholders being the primary starting point for corporate governance discipline, MHFG takes following measures to fully secure shareholder rights and appropriate exercise of their rights at general meeting of shareholders.
- MHFG provides accurate information through the "convocation notice of the ordinary general meeting of shareholders" to shareholders as necessary in order to facilitate appropriate decision–making at general shareholder meetings.
- MHFG strives to send the "convocation notice of the ordinary general meeting of shareholders" early enough to give shareholders sufficient time to consider the agenda. In addition, information included in the "convocation notice of the ordinary general meeting of shareholders" should be disclosed by TDnet or on its website.
- MHFG sets the date of its general meeting of shareholders to avoid dates on which many other companies conduct their general meetings.
- Other than via attending general meetings of shareholders, MHFG provides for voting via mail and voting via the internet. In addition, institutional investors can vote by electronic voting platform.
- When MHFG recognizes that a considerable number of votes have been cast against a proposal by the company and the proposal was approved, MHFG will analyze the reasons behind opposing votes and why many shareholders opposed, and consider the need for shareholder dialogue and other measures.
- MHFG gives adequate consideration to the exercise of shareholder rights, which includes recognizing the rights of minority shareholders.
- Where institutional investors hold shares under the street name, and wish in advance to exercise their right to vote in a general meeting of shareholders in place of the trust bank, MHFG deals with them in accordance with laws and regulations and Articles of Incorporation.
Related Principle of Corporate Governance Code
General Principle 1, Principle 1.1, Supplementary Principle 1.1.1, Supplementary Principle 1.1.3, Principle 1.2, Supplementary Principle 1.2.1, Supplementary Principle 1.2.2, Supplementary Principle 1.2.3, Supplementary Principle 1.2.4, Supplementary Principle 1.2.5
Dialogue with Shareholders
- Mizuho places one of the highest management priorities on continuing to disclose information to shareholders and investors in a fair, timely and appropriate manner, in order that they may form proper judgments and appraisals of the group. The President & Group CEO established the "Disclosure Policy," which summarizes basic principles regarding disclosure including investor relation activities for promoting constructive dialogue with shareholders and framework of disclosure controls and procedures, and MHFG has published it.
- Investor Relations Division handles IR activities, and Group Chief Financial Officer manages as managing executive officer.
- MHFG holds regular IR meetings for individual investors, institutional investors and overseas investors, and publishes IR materials on its website.Investor Relations Activities
IR Events
IR Presentations - IR activities for individual investorsAs part of our mission to provide the fullest possible disclosure to individual investors, MHFG provides on its web page the information of our management strategy, financial results, financial condition and capital management, in addition to audio streaming and archives of the internet conferences and IR meetings mentioned above.
With a view to expanding and improving further its two–way communication with investors centering on individual investors, MHFG runs an "IR contact page," which receives a broad range of questions and comments about IR, on the website. - Internal cooperation for dialogue with shareholders and investors
At MHFG, contents of securities reports, business reports, etc., are discussed at the Disclosure Committee, a business policy committee, which consists of the Group CGO, Group CFO, Group CRO, Group CHRO, Group CPO, Group CIO, Group CPrO, Group CCO, Group CSO, Group CSuO, Group CCuO and Group CAE in order to reflect the various perspectives of each group upon disclosure to shareholders and investors.
In addition, through IR Division's participation in various business policy committees, internal information is shared in order to promote constructive dialogues with shareholders. - Feedback to the management from IR activities
Shareholder views and concerns learned through IR activities are timely and appropriately reported to the management. - Establishment and implementation of Disclosure Controls and Procedures
MHFG endeavors to establish, implement and continuously improve its Disclosure Controls and Procedures to comply with applicable domestic and international laws and regulations as well as stock exchange rules and to implement fair, timely and appropriate corporate disclosure.
In addition, Mizuho respects various disclosure principles including fair disclosure. Accordingly, at individual calls, private meetings or conferences hosted or attended by representatives of Mizuho, Mizuho appropriately controls insider information by limiting carefully our explanations to matters already disclosed and facts commonly known.
Related Principle of Corporate Governance Code
General Principle 5, Principle 5.1, Supplementary Principle 5.1.1, Supplementary Principle 5.1.2, Principle 5.2
Basic Strategy for Capital Policy
- Mizuho have been pursuing the optimum balance between capital adequacy, growth investment and enhancement of shareholder return.Capital Management, Shareholder Return Policy and Dividend Information
IR Presentations
Related Principle of Corporate Governance Code
Principle 1.3
Policy Regarding Cross–holdings of Shares
MHFG has published the "Policy Regarding Cross–holdings of Shares" on its website. Policy Regarding Mizuho Financial Group's Cross–shareholdings of Other Listed Companies
Related Principle of Corporate Governance Code
Principle 1.4
Implementation of anti–takeover measures
MHFG doesn't implement anti–takeover measures.
Related Principle of Corporate Governance Code
Principle 1.5
Related Party Transactions
When MHFG engages in transactions with its directors or major shareholders (i.e., related–party transactions), in order to ensure that such transactions do not harm the interests of the Company or the common interests of its shareholders, MHFG has established the following system:
- MHFG has established internal regulations to prohibit conflicts of interest conduct, bribery of shareholders in relation to exercise of their rights, and favors to shareholders, and to disseminate and ensure compliance with an arm's-length relationship in related-party transactions. The Board of Directors, Audit Committee, Executive Management Committee, the President & Group CEO and Business Policy Committee receive reports and perform monitoring, with respect to the status of compliance, etc., periodically and as necessary.
- When directors or executive officers engage in transactions in the line of business of MHFG or transactions that have conflicts of interest, MHFG has expressly provided in the "Regulations of the Board of Directors," which was established as a result of a resolution of the Board of Directors, that such transactions are matters subject to approval by the Board of Directors, which are monitored at the Board of Directors through approval of or report on each actual transaction and audited at the Audit Committee pursuant to the "Audit Policies of the Audit Committee."
- When directors or executive officers engage in transactions in the line of business of MHFG or transactions that have conflicts of interest and the Board of Directors approves the matters, the legal risk division of MHFG conducts legal review. Additionally, the legal risk division also conducts legal review, as necessary, on matters concerning transactions between MHFG and its group company.
Related Principle of Corporate Governance Code
Principle 1.7, Principle 4.3, Principle 4.7
Relation with Stakeholders Other Than Shareholders
Measures against Sustainability Issues, Including Social and Environmental Matters
At Mizuho, we take an integrated view on sustainability and business strategy. We have designated materiality areas based on the expectations of society (the expectations of stakeholders for social impact to be made by the Mizuho group) and their importance for Mizuho (medium- to long-term impact on our corporate value and compatibility with Mizuho's strategies and business areas). Through our materiality-related initiatives, we will contribute to environmental conservation and the sustainable development and prosperity of the economy, industry, and society both in Japan and around the world. Also, we will engage in management practices that take into consideration value creation for various stakeholders and will work to enhance our corporate value through the sustainable and steady growth of the Mizuho group.
MHFG has published the initiatives for Sustainability on its website.
Related Principle of Corporate Governance Code
Principle 2.3, Supplementary Principle 2.3.1, Supplementary Principle 3.1.3, Supplementary Principle 4.2.2
Diversity
The Mizuho group firmly believes that, as stated in the People Philosophy, "the personal development of individual employees contributes to the stable and sustainable growth of the group as a whole". As such, Mizuho encourages employees who differ in terms of gender, country of origin, cultural background, and values to understand, respect, and inspire each other. Mizuho respects a workplace culture that embraces diversity and is committed to fostering growth and empowering employees. For more information, please refer to the Human capital management section on Mizuho's website.
Related Principle of Corporate Governance Code
Principle 2.4, Supplementary Principle 2.4.1
Whistleblowing System
- MHFG maintains a compliance hotline where employees, etc., may report when they find any problems concerning compliance, such as violation of laws.
- MHFG has established the Internal Controls and Audit Hotline, a system designed for obtaining concerns regarding questionable accounting or auditing matters from in and outside the company.
- Structure to ensure that persons who report are not treated disadvantageously due to such report has been set forth in the "Basic Policy of Compliance."
- Issues such as the handling of reports to a compliance hotline are reported to the Compliance Committee and the Board of Directors regularly, and is supervised by the Board of Directors. In addition, content of reports are reported to members of the Audit Committee.
- The Audit Committee supervises and verifies whether the whistle–blowing system is functioning effectively and whether the structure to provide the necessary information to the Audit Committee is established, and utilizes the information provided in its auditing duties.
Related Principle of Corporate Governance Code
Principle 2.5, Supplementary Principle 2.5.1
Appropriate Corporate Disclosure
MHFG published "Disclosure Policy," which states "we place one of the highest management priorities on continuing to disclose information to our customers, shareholders and investors both in and outside Japan in a fair, timely and appropriate manner, in order that they may form proper judgments and appraisals of the group."
This Integrated Report includes financial information as well as non-financial information on such subjects as ESG. The report presents information on Mizuho's efforts related to strategies, governance, and other subjects along with information on how those activities are leading to the creation of value for our customers, society, Mizuho over the short, medium, and longterms. It was edited with the intention of providing stakeholders with concise and clear explanations in a story–like form.
MHFG has also published "the new medium-term business plan" on its website.
Related Principle of Corporate Governance Code
General Principle 3, Principle 3.1, Supplementary Principle 3.1.1, Supplementary Principle 3.1.2
(As of July 4, 2025)
Reason for appointment as outside directors
Outside directors and reason for their appointment
| Name | Yoshimitsu Kobayashi |  |
| Reason for appointment and summary of expected roles | In addition to serving as Representative Director, Member of the Board, President and Chairperson of Mitsubishi Chemical Group Corporation, he has served as Chairperson of Japan Association of Corporate Executives, a member of the Council on Economic and Fiscal Policy, a member of the Industrial Competitiveness Council, a member of the Council for Science, Technology and Innovation and Chairman of the Council for Promotion of Regulatory Reform, among others. Currently, among others, he is actively performing the role of Chairman of the Board of Directors of Tokyo Electric Power Company Holdings, Inc.. As a senior executive of a global corporation which has diverse business operations, he has practiced sustainability management from early in his career and has deep insight in corporate governance. We propose to appoint him as an outside director based on our conclusion that he will be able to significantly contribute to, among other matters, increasing the effectiveness of both the decision-making and supervisory functions of the Board of Directors, from a perspective independent from that of the management. | |
| Activities on the Board of Directors and committees | By leveraging his broad experience as a senior executive and deep insight about the environment, society and corporate governance, he provides opinions and suggestions on the composition of the Board of Directors of Mizuho Financial Group and its subsidiaries for enhancement of corporate governance of the group at the Nominating Committee. In addition, at the Board of Directors Meeting, he played an appropriate role in performing the supervisory functions by, among other matters, providing opinions on training on the frontlines from the point of view of increasing the effectiveness of business continuity management systems, and opinions and suggestions on personnel development in light of medium- to long-term business strategy and development of global business. | |
| Name | Ryoji Sato |  |
| Reason for appointment and summary of expected roles | As he has served in positions such as Chief Executive Officer (CEO) of Deloitte Touche Tohmatsu LLC and Chairman of the Audit Committee of Toshiba Corporation, and he is currently active as a certified public accountant, he has auditing experience of various companies, including financial institutions, and experience of participating in the global management as the head of organizations who leads various lines of business, backed by his high level of expertise in finance and accounting. We propose to appoint him as an outside director based on our conclusion that he will be able to significantly contribute to, among other matters, increasing the effectiveness of both the decision-making and supervisory functions of the Board of Directors from a perspective independent from that of the management. |
|
| Activities on the Board of Directors and committees | By leveraging his deep insight and high level of expertise in finance, accounting and internal control systems, backed by his experience as Chief Executive Officer (CEO) of an audit firm and extensive experience as a certified public accountant, he provides opinions and suggestions at the Audit Committee on, among others, the desirable form of accounting audit that takes into account international trends, and development of specialists. In addition, at the Board of Directors Meeting, he played an appropriate role in performing the supervisory functions by, among other matters, providing opinions and suggestions on such matters as the importance of growth strategies and financial targets which take into consideration the improvement of corporate value, and business operations and communications leading to maintenance and improvement of employees' motivation. | |
| Name | Takashi Tsukioka | 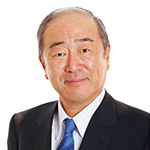 |
| Reason for appointment and summary of expected roles | As he has served as Representative Director, President and Chief Executive Officer, and Chairman and Representative Director of Idemitsu Kosan Co., Ltd. and President of Petroleum Association of Japan, he has extensive knowledge and expertise pertaining to sustainability as a senior executive of a global corporation in the energy industry, and has extensive experience concerning transformation through corporate mergers and other means, risk management such as crisis management and engagement of employees who have diverse values. We propose to appoint him as an outside director based on our conclusion that he will be able to significantly contribute to, among other matters, increasing the effectiveness of both the decision-making and supervisory functions of the Board of Directors, from a perspective independent from that of the management. |
|
| Activities on the Board of Directors and committees | By leveraging his extensive experience as a senior executive and deep insight in organizational management, as Chairman of the Audit Committee, he leads active discussion on various themes regarding audit, in addition to endeavoring to understand the state of affairs by communicating actively with directors, executive officers and employees in the group. In addition, at the Board of Directors Meeting, based on his experience as a senior executive, he played an appropriate role in performing the supervisory functions by, among other matters, providing opinions and suggestions on communication strategies with respect to stakeholders from the point of view of contributing to the vitality of the organization, the process of formulating and disseminating Mizuho's Corporate Identity, business strategies leading to gaining customers' trust, fiduciary duty and the role as a main bank. | |
| Name | Kotaro Ohno (New appointment) |  |
| Reason for appointment and summary of expected roles | He has served in positions such as Vice-Minister of Justice, Superintending Prosecutor and Prosecutor-General, and he is currently active as an attorney-at-law. In addition, having served as the chairperson of the nominating committee and the audit committee as an outside director of other companies, he has extensive knowledge and expertise in organizational management and corporate governance as well as expertise in legal affairs and crisis management. We propose to appoint him as an outside director based on our conclusion that he will be able to significantly contribute to, among other matters, increasing the effectiveness of both the decision-making and supervisory functions of the Board of Directors from a perspective independent from that of the management. Although he has not previously been engaged in management of a company other than in his career as an outside director and outside audit & supervisory board member, we believe he will fulfill the duties of an outside director of Mizuho Financial Group appropriately due to the reasons stated above. |
|
| Name | Masami Yamamoto |  |
| Reason for appointment and summary of expected roles | After serving as the Representative Director, President and the Representative Director, Chairman of Fujitsu Limited, he is currently active as Director, Senior Advisor of this company, and through his extensive experience as a senior executive of a global IT corporation, he has extensive knowledge concerning the IT industry and experience of serving in managerial positions at an organization with high specialty such as engineers. We propose to appoint him as an outside director based on our conclusion that he will be able to significantly contribute to, among other matters, increasing the effectiveness of both the decision-making and supervisory functions of the Board of Directors, from a perspective independent from that of the management. |
|
| Activities on the Board of Directors and committees | By leveraging his extensive experience as a senior executive and his deep insight and expertise in the field of technology, as Chairman of the Compensation Committee, he provides opinions and suggestions on, among other matters, the desirable executive compensation system that takes into account international trends, and leads discussion with respect to the decision on executive compensation. In addition, at the Board of Directors Meeting, he played an appropriate role in performing the supervisory functions by, among other matters, providing opinions and suggestions on the importance of system subsidiaries in the business strategies of the group, utilization of IT aiming at stable operation of business and productivity improvements, etc., and human resource systems and operations and the securing and training of personnel, leading to higher employee motivation. | |
| Name | Hiromichi Shinohara (New appointment) |  |
| Reason for appointment and summary of expected roles | In addition to having served as CTO, CISO, Senior Executive Vice President and Chairman of the Board (Kaicho) and Chairman of the Board of Directors of Nippon Telegraph and Telephone Corporation, he is actively performing the roles of Vice Chair and Chair of Committee on Digital Economy of Keidanren (Japan Business Federation), a member of the Council for Science, Technology and Innovation of Cabinet Office. Through his extensive experience as a top executive in corporate management and research and development, he has expert knowledge in corporate governance and technology, as well as a high level of expertise in human resource development, and the creation of a sustainable society through the use of technology. We propose to appoint him as an outside director based on our conclusion that he will be able to significantly contribute to, among other matters, increasing the effectiveness of both the decision-making and supervisory functions of the Board of Directors, from a perspective independent from that of the management. |
|
| Name | Izumi Kobayashi |  |
| Reason for appointment and summary of expected roles | As she has served as President and Representative Director of Merrill Lynch Japan Securities Co., Ltd. (current BofA Securities Japan Co., Ltd.), and Executive Vice President of the Multilateral Investment Guarantee Agency of the World Bank Group, she has extensive experience as heads of global organizations known for its diversity and deep insight in the field of finance, sustainability and risk governance and other fields. We propose to appoint her as an outside director based on our conclusion that she will be able to significantly contribute to, among other matters, increasing the effectiveness of both the decision-making and supervisory functions of the Board of Directors, from a perspective independent from that of the management. |
|
| Activities on the Board of Directors and committees | By leveraging her extensive experience as a senior executive and her deep insight and expertise in the field of finance and sustainability, at the Board of Directors Meeting, she provides opinions and suggestions that take into consideration the broad array of stakeholders, among others, the significance of holding the shares of other companies as cross – shareholdings, dissemination of Mizuho's Corporate Identity, fiduciary duty and sustainability activities. In addition, as the Chairman of the Board of Directors, she demonstrated her excellent skills and played an appropriate role in performing the supervisory functions by, among other matters, endeavoring to understand the circumstances surrounding us by communicating with directors, executive officers and employees of Mizuho Financial Group, including the President & Group CEO, full-time members of the Audit Committee, members of the Board of Directors of subsidiaries and investors, etc., and leading various discussions at the Board of Directors Meeting. | |
| Name | Yumiko Noda (New appointment) |  |
| Reason for appointment and summary of expected roles | After having worked at financial institutions and consulting firms, and having served as Deputy Mayor of Yokohama City, she has been actively performing the roles of President and Representative Director, and, currently, Chairman and Representative Director, of Veolia Japan K.K., and, furthermore, has also been appointed to Vice Chair of Keidanren at the end of May this year. She has demonstrated leadership in diverse organizations, and through her extensive experience as a senior executive of a global corporation in the environmental services business, she has a wealth of experience and knowledge in sustainability and deep insight in financial fields including PFI. We propose to appoint her as an outside director based on our conclusion that she will be able to significantly contribute to, among other matters, increasing the effectiveness of both the decision-making and supervisory functions of the Board of Directors, from a perspective independent from that of the management. |
|
Policy Regarding Mizuho Financial Group's Cross–shareholdings of Other Listed Companies
Mizuho Financial Group and our Three Core Companies* have established and published a Policy Regarding Cross–shareholdings of Other Listed Companies and Standards Regarding the Exercise of Voting Rights Associated with Cross–shareholdings.
* "Three Core Companies" refers to Mizuho Bank, Ltd., Mizuho Trust & Banking Co., Ltd. and Mizuho Securities Co., Ltd.
Policy Regarding Mizuho Financial Group's Cross–shareholdings of Other Listed Companies
- As a basic policy, unless we consider these holdings to be meaningful, Mizuho Financial Group and the Three Core Companies will not hold the shares of other companies as cross–shareholdings. This reflects factors including the changes in the environment surrounding Japan's Corporate Governance Code and the potential impact on our financial position associated with stock market volatility risk.
- We consider cross–shareholdings to be meaningful if they contribute to the maintenance and improvement of the corporate value of issuers and the Mizuho group based on their growth potential, outlook, or revitalization perspectives or as a result of studies on present and future economic feasibility and profitability.
- We will regularly and continually examine whether shares held as cross–holdings are meaningful, and we will dispose of holdings determined to be deficient in meaning with due regard to the impact on the market and other matters. Through dialogue with the issuing companies, we will also reduce even those holdings we consider to be meaningful.
Standards Regarding the Exercise of Voting Rights Associated with Cross–shareholdings
- Mizuho Financial Group and the Three Core Companies will exercise voting rights after comprehensive consideration of whether an issuing company has established effective corporate governance and is making appropriate decisions to improve its corporate value over the medium to long term. We will also consider any impact to our own corporate value. Further, if we are unable to agree on proposals made by issuing companies, we may consider disposing of our share holdings.
- We will consider specific proposals through dialogue with the issuing companies and studies conducted by our own specialized departments. In particular, when proposals such as those listed below could affect corporate value or shareholder interests, we will decide on the exercise of voting rights after comprehensive consideration of the purposes of the proposals and the issuing company's approach to improving corporate value.
- Proposals to re–elect directors and auditors, grant retirement benefits, pay bonuses and increase compensation amounts when an issuing company has posted a loss or paid no dividends for a certain period of time, or a corporate scandal has occurred.
- Proposals to re–elect representative directors when profit on capital is going through a long–term slump, when after convening a general meeting of shareholders a company has less than the required number of independent directors or no female directors, or when a company holds excessive cross–shareholdings.
- Proposals to appropriate retained earnings when there are ongoing low dividend distributions or when such proposals, if resolved, may adversely affect financial soundness.
- Proposals to adopt or continue anti–takeover measures.
- Proposals for reorganization such as through a merger.
- Proposals for capital strategies, including issuing new shares.
- Proposals to grant stock options to dilute overall shares.
- Proposals to change articles of incorporation that may impact shareholder value.
- Proposals based on shareholder proposals.
Process for assessing whether cross–shareholding is meaningful
Taking into account our Policy Regarding Mizuho Financial Group's Cross–shareholdings of Other Listed Companies, we assess whether cross–shareholding is meaningful using the process outlined below.
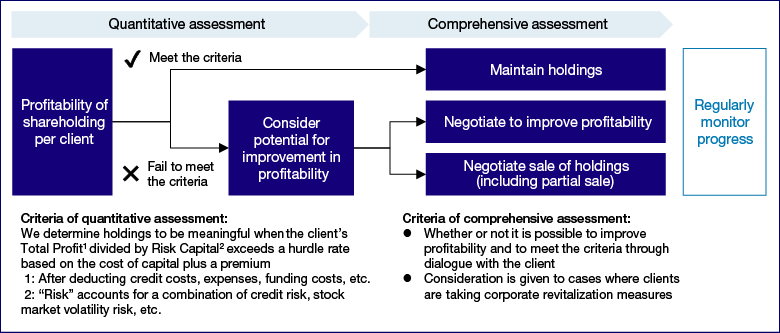
- We will continue to hold the shares of clients if those shares meet certain profitability standards based on a quantitative assessment. However, in light of factors including the changes in the environment surrounding Japan's Corporate Governance Code and the potential impact on our financial position associated with stock market volatility risk, we are working to reduce our cross–shareholdings through dialogue with our clients.
- For those shares that also fall short of profitability standards based on a comprehensive assessment, we will draw on our relationship of trust with the client in order to engage with them in constructive dialogue. If improvements in profitability can be made as a result, we will continue to hold the shares, but if improvement is not possible, we will negotiate with the client regarding the sale of the shares.
- We periodically confirm the status of negotiations for the sale of cross–shareholdings, client efforts to improve profitability, and other matters. Additionally, once per year at a meeting of the Board of Directors, we conduct an assessment of whether it is meaningful to maintain shares of each of the domestically listed stocks that we are holding.
- In our assessment of cross-shareholdings as of the end of March 2024, of domestically listed stocks that we are holding (JPY 916.9 billion in total on a consolidated acquisition cost basis as of the end of March 2024), around 30% did not meet the standards for continued holding.
- The results of the assessment may vary based on our business relationship with the client, the market environment, and other factors at the time of assessment, but we will continue to work steadily to reduce our cross–shareholdings.
- Note that we also conduct a similar assessment for deemed holdings of shares.
Reduction of cross–shareholdings
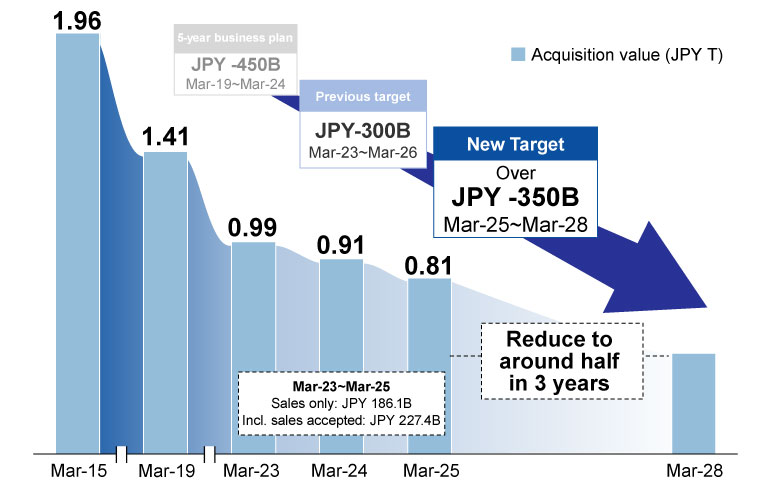
- The sales performance for FY2023–2024 was JPY 186.1 billion, reflecting steady progress.
- To achieve the reduction target over JPY 350 billion for FY2025–2027, we will continue to engage in careful negotiations with our clients through dialogue.
- Regarding deemed holdings of shares, the projected reduction for FY2025–2027 is JPY 200.0 billion.
Composition and skills of the Board of Directors
Skills that the Board of Directors should possess as a whole
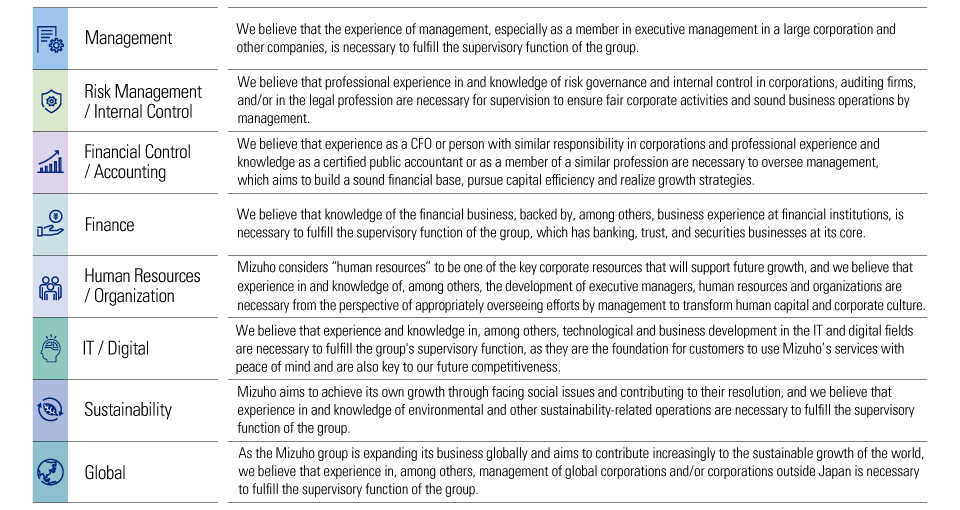
In light of the recent revision of the group's Corporate Identity and the review and formulation of a new medium-term business plan that takes into account the direction for growth we will pursue over the long term, Mizuho Financial Group has clarified the areas in which the Board of Directors as a whole should possess specific skills in order to ensure speedy corporate management and appropriate supervisory functions toward realization of the plan. Specifically, the group has selected the eight skill areas of "Management," "Risk Management / Internal Control," "Financial Control / Accounting," "Finance," "Human Resources / Organization," "IT / Digital," "Sustainability," and "Global."
Basic approach to selection of skills
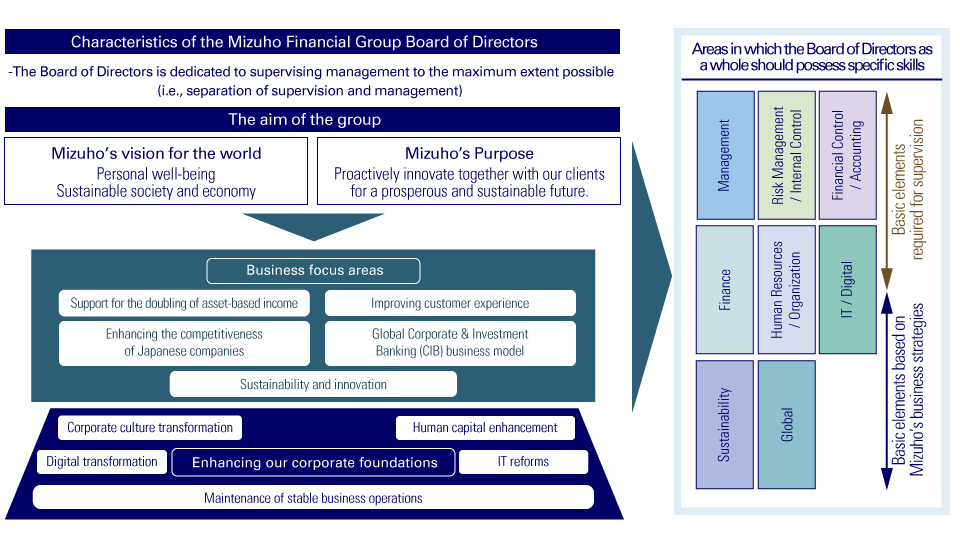
Main reasons for selecting each skill and approach to main experience and knowledge deemed necessary
Skill Matrix of the Board of Directors
The table below lists the particular core skill areas that each director possesses in relation to the skills that the Board of Directors as a whole should possess, and with which Mizuho Financial Group believes the Board of Directors as a whole has the necessary skills. We also believe that each committee is equipped with the necessary skills based on their respective roles, including securing the knowledge of outside committee members at the meetings of voluntary committees.
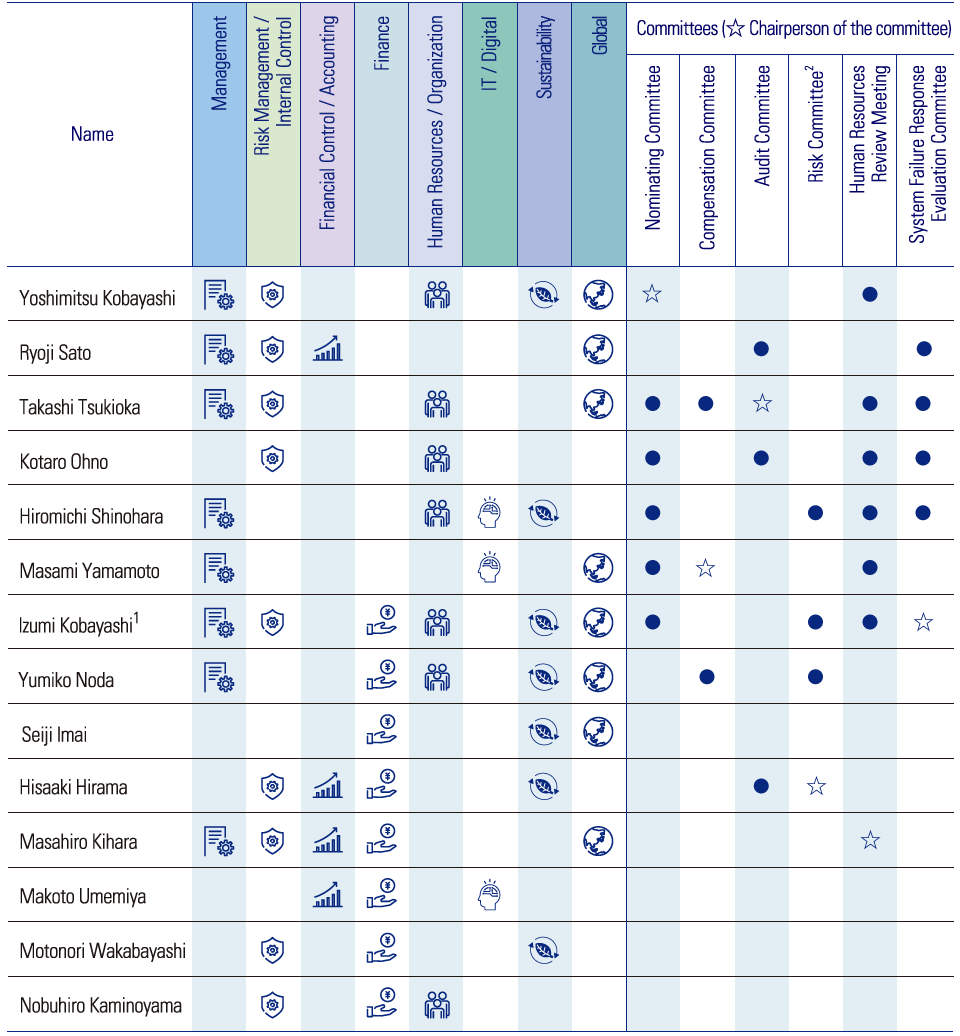
Notes:
- Chairperson of the Board of Directors
- The following two outside experts serve on the committee:
Rintaro Tamaki (President, Japan Center for International Finance)
Hiroshi Naka (Professor, the University of Tokyo Institute for Future Initiatives)
Compensation for executive officers
Basic policy1
Our executive compensation system is designed to achieve the following objectives and approaches pursuant to the basic policy on management under the Mizuho Financial Group's Corporate Identity.
- The full text of the "Basic Policy for Executive Compensation" is posted on the Mizuho Financial Group's website.
https://www.mizuhogroup.com/who-we-are/governance?tab=rules-and-reports-etc#basic
Compensation system
- Payment will be made monthly in cash in accordance with the roles and responsibilities of each of the Officers.
- Payment in accordance with the roles and responsibilities of each of the Officers as an incentive to increase corporate value over the medium to long term and for other purposes.
- Payment in accordance with level of achievement of financial indicators emphasized by the Mizuho Financial Group and evaluation of indicators related to stakeholders as an incentive to increase corporate value over the medium to long term and for other purposes.
- Payment in accordance with level of achievement of financial indicators emphasized by the Mizuho Financial Group and the evaluation of individual performance as an incentive for fiscal year performance to increase corporate value.
- Deferred payment over three years starting the fiscal year after next for payments above a certain amount.
- A system has been adopted that enables malus (forfeiture of compensation remaining unpaid) and clawback (request for return of compensation) by resolution of the Compensation Committee depending on the performance of the group or the individual.
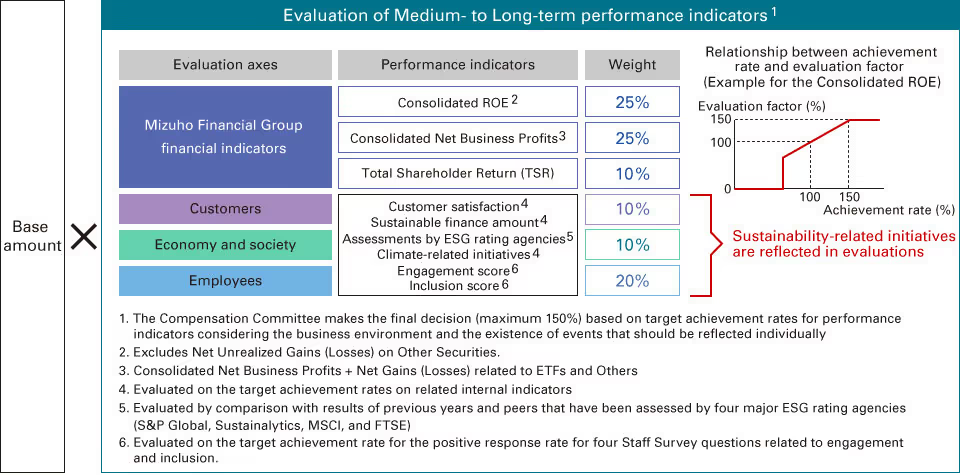
Performance evaluation indicators for performance-linked compensation
Medium- to Long-term Incentive Compensation (Stock Compensation II)
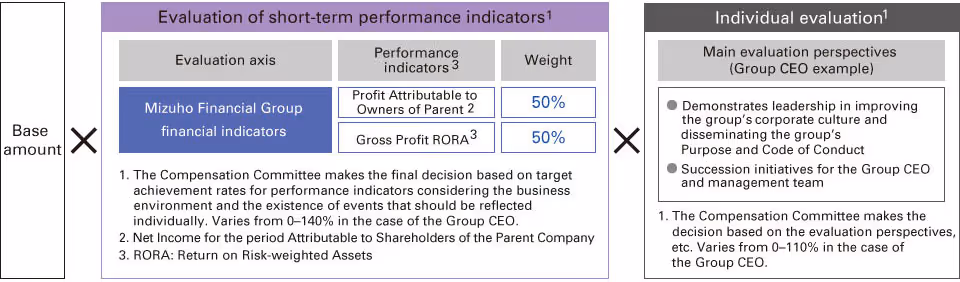
Short-term Incentive Compensation1
- The evaluation factor for the short-term performance indicators and individual evaluation is capped at 150%
Compensation Governance
Individual compensation determination process
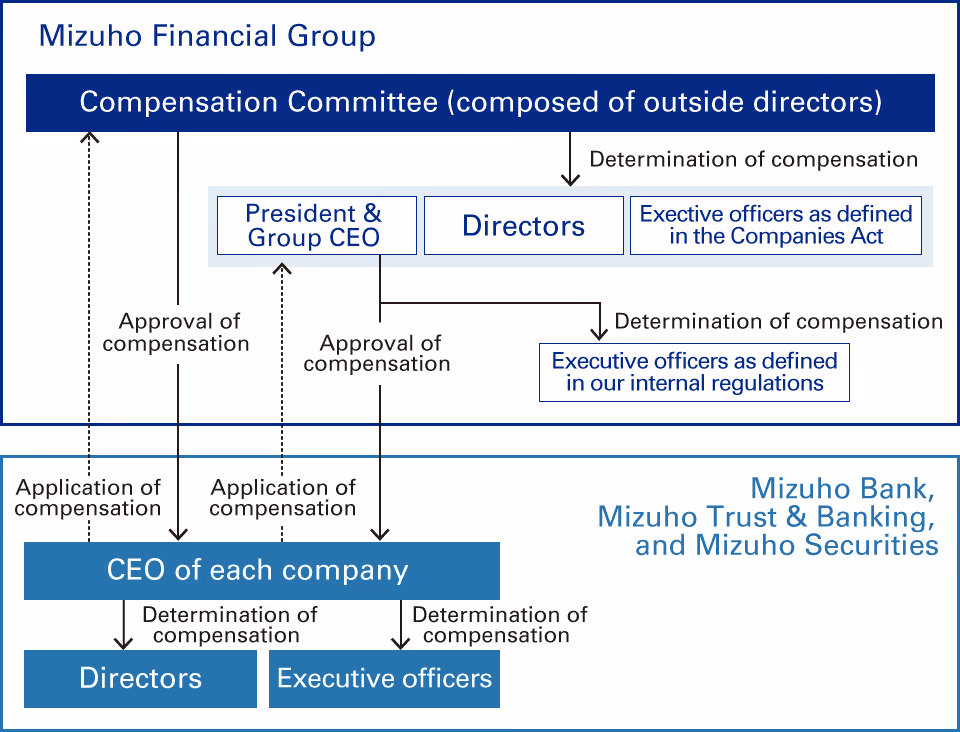
The Compensation Committee shall determine the executive compensation system including the compensation system taking into account the Basic Policy for Executive Compensation. In addition, in order to ensure fairness and objectivity concerning the compensation for each officer, the Compensation Committee shall determine the compensation for each individual director and executive officer of Mizuho Financial Group as defined in the Companies Act and approve the compensation of each individual director of the Three Core Companies (Mizuho Bank, Mizuho Trust & Banking, and Mizuho Securities).
Individual compensation determination process diagram
Appropriateness of compensation level and composition
We conduct a market survey each year with other companies in the same industry and similar-scale corporate groups as the peer group, and examine the appropriateness of the compensation level and composition.
Amounts of compensation
Aggregate amounts of compensation paid to directors and executive officers as defined in the Companies Act
Shown below are the compensations of the directors and executive officers as defined in the Companies Act.
The aggregate compensation paid to directors who concurrently serve as executive officers as defined in the Companies Act is included in the below table as those of "Executive officers as defined in the Companies Act."
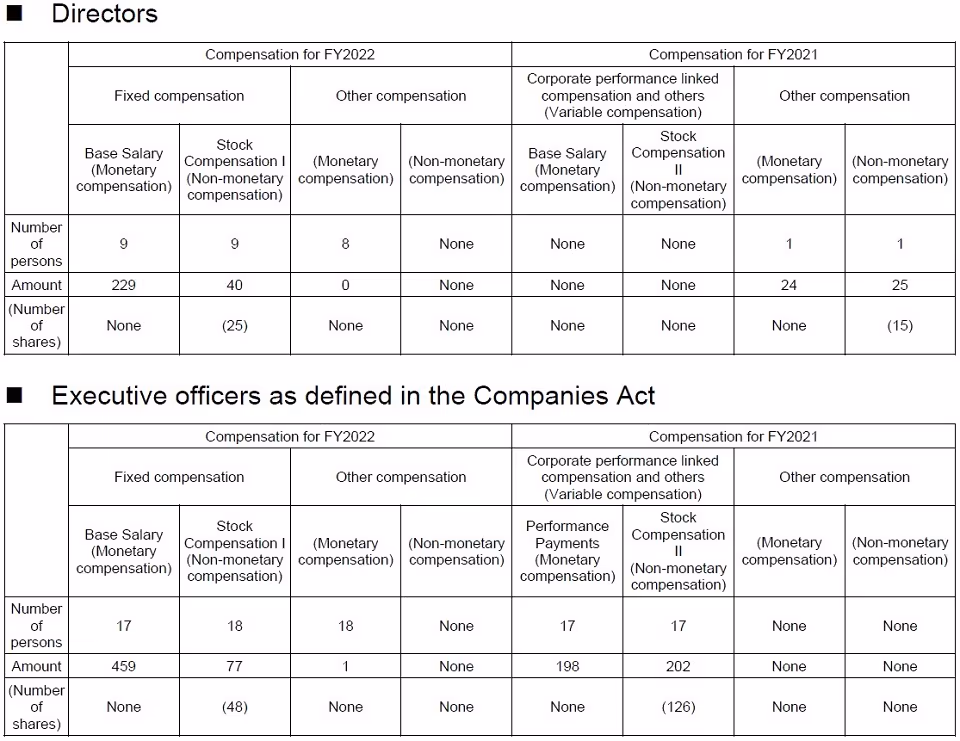
Notes:
- The amounts are indicated in units of one million yen and the numbers of shares are indicated in units of one thousand. Fractions are rounded down.
- The number of directors in the "Fixed compensation" column for the Compensation for fiscal year 2022 includes one director who retired on June 21, 2022. The number of executive officers for the Compensation for fiscal year 2021 includes one executive officer who resigned on November 26, 2021, one executive officer who resigned on January 17, 2022, one executive officer who was dismissed (*) on February 1, 2022 and two executive officers who resigned on April 1, 2022.
(*Due to health reasons, the original plan (resignation on April 1, 2022) was moved forward.) - With respect to Stock Compensation I for fiscal year 2022, the amounts given are obtained by multiplying the stock ownership points, granted by the Compensation Committee of Mizuho Financial Group in July 2022 for fiscal year 2022 based on the functions and responsibilities of each of the Officers (one (1) point translates into one (1) share of common stock of Mizuho Financial Group), by the book value of Mizuho Financial Group stock (JPY 1,607.087 per share). Stock Compensation I is not linked to the performance of the group and shall be paid at the time of resignation.
- The other compensation for fiscal year 2022 includes condolence money premiums and other premium subsidies (group life insurance premiums paid by the group to the Officers as the insured party).
- The target and result of key indicators related to the corporate performance linked compensation and others (variable compensation) for fiscal year 2021 are as follows:
- With respect to the Performance Payments, the amounts stated were decided by the Compensation Committee of Mizuho Financial Group in July 2022 as the Performance Payments for fiscal year 2021.
- With respect to the Stock Compensation II, the amounts given are obtained by multiplying the stock ownership points, granted by the Compensation Committee of Mizuho Financial Group in July 2022 for fiscal year 2021 based on the functions and responsibilities and performance of each of the Officers, by the book value of Mizuho Financial Group stock (JPY 1,607.087 per share). Stock Compensation II for fiscal year 2021 is expected to be paid as deferred payments over three years from fiscal year 2023.
- With respect to the other compensation for fiscal year 2021, the amount of fixed compensation paid in deferral is stated. The fixed compensation paid in deferral is a system whereby the decision to pay a portion of the fixed compensation is deferred and can be reduced or forfeited in accordance with the performance of Mizuho Financial Group and other factors.
- Because the amount of the corporate performance linked compensation and others (variable compensation) to be paid with respect to fiscal year 2022 has not yet been determined at present, the aggregate compensation above does not include the amount of corporate performance linked compensation and others (variable compensation); however, the necessary reserve is recorded for accounting purposes.
- Since the Compensation Committee determines the executive compensation system, including the compensation system, taking into account the Basic Policy for Executive Compensation, we believe that the details of individual compensation for directors and executive officers as defined in the Companies Act are in line with the Basic Policy for Executive Compensation.
*For information on the compensation system related to the above results, please refer to the following.
Rules and Report, etc. (Corporate Governance)
Articles of Incorporation
Articles of Incorporation (PDF/221KB)Corporate Governance Guidelines
Corporate Governance Guidelines (PDF/305KB)The Corporate Governance Guidelines (the "Guidelines") set out the fundamental perspectives regarding corporate governance in Mizuho, and the framework of the corporate governance system, including the roles, composition, and governing policies regarding the Board of Directors, executive officers, Nominating Committee, Compensation Committee, and Audit Committee for Mizuho Financial Group as a Company with Three Committees.
Overview of Independence Standards for Independent Directors
Overview of Independence Standards for Independent Directors (PDF/341KB)The standards, which MHFG set out concerning Independence for Outside Directors.
Basic Policy for Executive Compensation, etc.
Basic Policy for Executive Compensation (PDF/305KB)The policy, which MHFG set out concerning the determination of compensation for each individual director and executive officer ("Officers") of MHFG as well as MHBK, MHTB and MHSC ("Core Subsidiaries").
Outline of Compensation System and Compensation Determination Process.
Corporate Governance Report
Corporate Governance Report (As of April 3, 2026) (PDF/948KB)The report, submitted to the Tokyo Stock Exchange, sets out the status of corporate governance system.
Risk Governance
Recognition of risks relating to Mizuho’s business
We designate risks that we recognize as potentially having a major impact on the Mizuho group as "top risks".
When selecting our top risks for fiscal 2025, we considered major trends in politics, the economy, society, and technology. In terms of politics and the economy, we recognize the risk that uncertainty in global markets will increase, given the signs of a backlash against globalism—evidenced by the rise of populism and changes in the post-war global order—as well as the trend toward expansionary fiscal policy in many countries. Meanwhile, it is also essential to take action in response to societal and technological developments such as the environmental crisis resulting from climate change, the diversification of customer needs resulting from the emergence of the digital native generation, changes in the competitive environment accompanying further technological advancement, and the risk of more sophisticated financial crime.
Top risks (As of March 2025)
- The waning of Japan's economy and businesses
- Sharp and rapid slowdown of the US economy
- Emergence of sovereign risks in various countries
- Intensified trade war and conflict risks
- Cyberattacks
- IT system failures
- Worsening impact of climate change and inadequate environmental response
- Money laundering / Financing of terrorism
- Improper acts and omissions by executive officers/ employees
- Stagnation of sustainable growth due to talent shortages
- Insufficient response to AI and other technologies
- Occurrence of natural disasters that could cause business disruptions
Top risks are primarily selected based on management discussions including a business policy committee (the Risk Management Committee), combined with opinions from a voluntary committee (the Risk Committee).
Risk appetite framework (RAF)
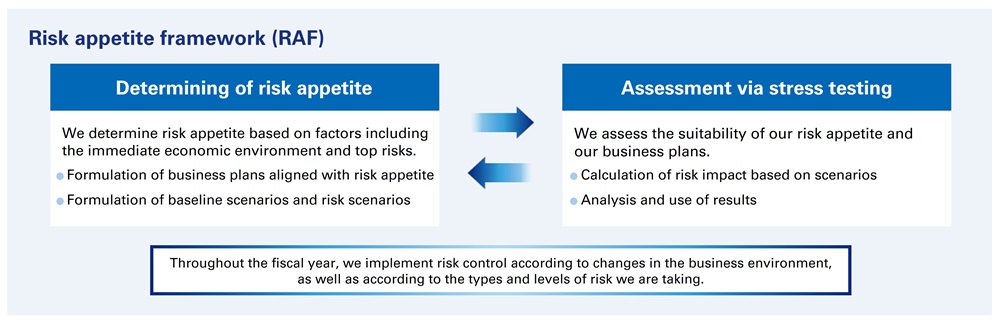
We introduced our RAF as a corporate management framework to execute risk-taking in a manner that is consistent with our risk appetite. Risk appetite refers to the types and levels of risk that we will accept in order to implement our business and financial strategies.
When we formulate business plans, information is shared among management regarding the immediate economic situation, as well as top risks and other potential risk events, to determine a risk appetite aligned with our strategies. In addition, we conduct stress testing based on risk scenarios formulated to take into account vulnerabilities in Mizuho’s business and finance structures, among other factors. Such stress testing enables us to assess the suitability of our risk appetite and the validity of our business plans.
We regularly monitor changes in the external business environment and the types and levels of risk we are taking, and the results are reported to management. If changes have occurred in the business environment, business units (the first line of defense) discuss with risk management departments (the second line of defense) to devise a risk control strategy, and they also review Mizuho’s risk appetite as necessary.
Management of Top Risks
We have identified "top risks" (i.e., risks that are recognized to have a major potential impact on the Mizuho group) as follows, while taking into consideration factors such as changes in the internal and external business environment, and risks with the potential to manifest in the future (emerging risks).
For these top risks, we have decided on additional risk control measures, including measures for preventing the risks and follow-up responses, and we are monitoring the status of risk control throughout the fiscal year and reporting to the Risk Committee and Board of Directors.
Top risks
Risk event
Risk scenario
The waning of Japan's economy and businesses
- In addition to growing uncertainty in business operations caused by various countries’ tariff policies, China’s economic slowdown and deflationary exports put downward pressure on the profitability of Japanese companies.
- Due to increasing inflationary pressures, interest rates in Japan rise sharply, potentially triggering systemic risk as vulnerabilities within some financial institutions become apparent.
- In the medium term, Japan’s low growth rate, stemming from the low birthrate, increased longevity, and a declining population, diminishes the international competitiveness of Japanese companies.
Sharp and rapid slowdown of the US economy
- High tariffs lead to price increases in the US, reigniting inflation. The sustained high-interest-rate environment increases the interest burden on both businesses and households.
- Expectations of tax cuts and deregulation drive stock markets above their fair value. A sudden drop in these excessive expectations triggers an accelerated capital outflow.
- Localized events among financial sponsors and non-bank financial intermediaries (NBFIs) trigger a sharp contraction in private credit and private equity.
Emergence of sovereign risks in various countries
- Expansive fiscal policies lead to increased debt levels in various countries, or political and social unrest causes sovereign bond yields to spike or results in downgrades.
- In Japan, concerns about fiscal instability are triggered by lax fiscal discipline or a significant increase in government bond issuances, leading to rising longterm interest rates.
Intensified trade war and conflict risks
- Protectionist policies in various countries set back free trade. The escalating US-China conflict puts downward pressure on the Chinese economy. China’s long-term economic stagnation and deflationary exports slow down the global economy.
- As the post-war international order changes, rising tensions between nations spill over into economic strain and military conflicts.
Cyberattacks
- Amid the rapid proliferation of AI and rising geopolitical risks, cyberattacks from specific nations and criminal or terrorist organizations increase.
- Inadequate management and response measures, including those involving third parties, lead to the exposure of customer information or service interruptions.
IT system failures
- Major system failures occur due to human error, equipment malfunctions, or cyberattacks.
- Inadequate operational resilience measures lead to prolonged recovery times and delays in providing alternatives, causing extensive inconvenience and detriment to customers.
Worsening impact of climate change and inadequate environmental response
- A reversal in the ESG movement and difficulties in achieving international consensus on climate action lead to uneven and delayed transitions across societies, exacerbating the impacts of climate change.
- Despite being continually required to address environmental considerations and manage transition and physical risks, financial institutions do not implement adequate responses due to business impacts, energy security concerns, and data and technology constraints.
Money laundering / Financing of terrorism
- Serious legal violations occur due to a lack of awareness of laws and sanctions, inadequate system support, and diminished compliance awareness.
- As financial businesses diversify and technology advances, criminal methods become more sophisticated, leading to the misuse of financial services for criminal and terrorist activities, which results in criticism from the international community.
Improper acts and omissions by executive officers/employees
- Legal and regulatory violations, both domestic and international.
- Criticism arises due to business practices that diverge from societal expectations, including business practices that are not customer-oriented.
Stagnation of sustainable growth due to talent shortages
- An accelerated talent exodus; recruitment difficulties; lower employee performance and delayed talent development resulting from a lack of respect for employee initiative and diversity; and similar factors damage human capital.
- Deteriorating working conditions, such as overwork, result in legal violations and reputational damage.
Insufficient response to AI and other technologies
- As customers increasingly adopt technologies like AI, there is a shift in the requirements for our products and services, as well as the competitive landscape.
- Inadequate investment in technology, inadequate initiatives, and inadequate understanding of customer needs result in inferior marketability and productivity.
- Insufficient responses to cyberattacks that exploit new technologies such as generative AI and to financial crimes such as money laundering lead to significant losses.
Occurrence of natural disasters that could cause business disruptions
- A major earthquake, such as an earthquake centered on Tokyo or in the Nankai Trough, or severe winds and flooding cause extensive human casualties and property damage, including building collapses.
- Extensive human casualties and property damage affect the Tokyo metropolitan area, making it difficult to provide critical services such as payment processing.
Note: The risks described here are only some of the possible risks we are aware of. For more comprehensive information on the Mizuho group’s risks, please refer to the annual securities report, Form 20-F, and other related documents.
Comprehensive Risk Management
Comprehensive Risk Management Systems
At Mizuho, under the basic approach to the implementation of our RAF, we maintain a comprehensive risk management structure ascertaining and assessing overall risk and restricting risk to within a range that is permissible for business.
Under the comprehensive risk management structure, we classify and manage the risks that arise in our businesses according to the various kinds of risk, including credit risk, market risk, liquidity risk, and operational risk. Moreover, our group companies manage risk appropriately according to the nature of their risk, such as settlement risk, trust banking operations risk, and similar.
When considering the adoption of new products and services, we check predetermined specific criteria relating to the characteristics of each risk, and institute countermeasures as required.
We have also put in place a system whereby each Mizuho Financial Group company conducts risk management appropriate for the company's business operations and scope and status of risk, and Mizuho Financial Group, as the holding company, oversees risk management across the whole group.
The Risk Management Committee chaired by the Group Chief Risk Officer (Group CRO), which meets monthly, provides integrated monitoring and management of the overall risk for the Mizuho group. The Group CRO reports the risk management situation to the Board of Directors, the Risk Committee, and the Executive Management Committee regularly and as necessary. In addition, Mizuho Financial Group receives reports and applications for approval concerning the risk management situation from our core group companies* and gives them appropriate instructions concerning risk management as necessary.
* Mizuho Bank, Mizuho Trust & Banking, Mizuho Securities, Mizuho Research & Technologies, Asset Management One, Mizuho Innovation Frontier, Mizuho Americas, Custody Bank of Japan, MI Digital Services, and Mizuho Leasing.

1. Complex risk spanning other risks.
2. Risk that could amplify other risks.
Risk capital allocation
At Mizuho, under the risk capital allocation framework, we endeavor to obtain a clear grasp of the group’s overall risk exposure using a unified measurement standard, and we implement measures to make sure this exposure is within limits that are acceptable.
More specifically, we allocate risk capital to our core group companies (including their subsidiaries) to control risk within the limits set for each company. We also control risk within acceptable limits by working to ensure that the overall risk on a consolidated basis does not exceed our financial capacity. To ensure the ongoing financial soundness of Mizuho Financial Group and our core group companies we regularly monitor the manner in which risk capital is being used in order to obtain an accurate grasp of the risk profile within this framework. Reports are also submitted to the board of directors and other committees of each company. Risk capital is allocated to Mizuho Bank, Mizuho Trust & Banking, Mizuho Securities, and Mizuho Americas by risk category, and is further allocated within their respective business units.
Framework for allocating risk capital
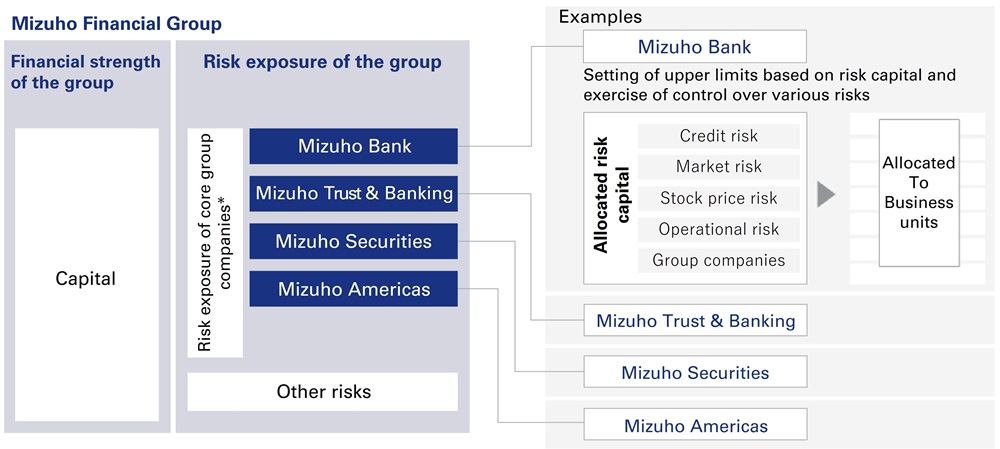
* Includes the risk exposure of group companies that are managed by core group companies.
Stress testing
At Mizuho, we assess the suitability of our risk appetite and the validity of our business plans through stress testing, calculating and assessing the financial effect on our capital adequacy ratio and on our performance.
We carry out stress testing based on scenarios formulated taking into account current economic conditions and future outlooks, vulnerabilities in Mizuho’s business and finance structures, and other factors. In this way, we can confirm whether our capital adequacy ratio, performance, and other indicators are sufficient in the case that stress events actually materialize. If such indicators fall below the necessary level, we reconsider and revise our risk appetite and business plans. In addition, we calculate the impact on risk levels, including interest rate risk in the banking book, and confirm the balance between this risk capital and owned capital at the post-stress stage to assess the adequacy of the capital level.
In addition, to structure robust risk management systems, stress testing is also used to manage risk in various risk categories, such as liquidity risk and market risk.
Mizuho Research & Technologies merged with Mizuho Bank in April 2026.
Cybersecurity
Basic approach
Damage caused by increasingly sophisticated cyberattacks is on the rise. Breaches of personal information held by corporates and a record amount of unauthorized money transfers from phishing are some examples witnessed in 2023. At Mizuho, we are continuously pressing forward with cybersecurity measures as per our Declaration of Cybersecurity Management, to allow customers to use our services with the peace of mind that they are secure.
Declaration of Cybersecurity Management
Governance system
At Mizuho, we have established the position of Group Chief Information Security Officer (Group CISO), who administers overall group-wide / global cybersecurity management. In the interest of clarifying how the check-and-balance system applies to the Group Chief Information Officer (Group CIO) as part of our second line of defense, the Group CISO reports to both the Group CIO and Group Chief Risk Officer (Group CRO). We are striving to enhance our cybersecurity posture by implementing this system of double reporting. The Group CISO, as the person responsible for cybersecurity risk management, reports to the Executive Management Committee and Board of Directors the progress of the various measures taken, and works with management to review cybersecurity policies and resource allocation in a timely and appropriate manner.
We have appointed a person in charge of cybersecurity and have established a communication system at group companies, to monitor the status of our cybersecurity measures and to quickly gather information when an incident occurs.
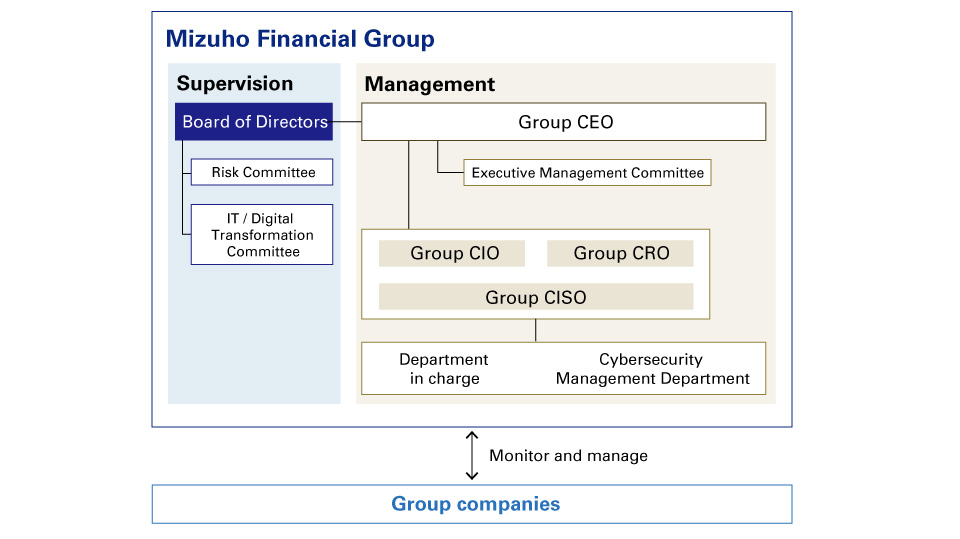
Incident response
Our specialist units, particularly SOC1 and Mizuho-CIRT2, work closely with external specialized organizations to respond to cybersecurity incidents. SOC detects suspicious activity to identify potential threats using a 24-hour, 365-day monitoring framework, while Mizuho-CIRT shares information with internal and external partners to better handle incident response, investigation, and recovery based on the information received from SOC.
These specialist units have established a procedure for responding to different cyberattack methods, and are constantly conducting internal and external training and drills to properly respond to any incident.
- Security Operation Center (a specialized team that monitors and analyzes threats to information systems in organizations such as other corporates)
- Cyber Incident Response Team (incident response teams that specialize in information security issues within the organization)
.avif)
Surveillance at a location outside Japan
Cybersecurity measures
Our cybersecurity measures include group-wide, global, and supply chain scopes. In order to identify and prevent cybersecurity risks, we collect threat intelligence from public institutions, trusted communities, the media, and other sources, and prioritize measures based on potential impact on our company.
Modern systems are constantly exposed to a wide variety of security threats. We take measures to ensure consistent security throughout the system development lifecycle, from planning through development and operation.
Our systems have a virus analysis and a multi-layered defense mechanism, and we are working to strengthen our resilience by implementing TLPT1 to test the effectiveness of these technical measures and the effectiveness of the response process.
In order to evaluate the maturity of these cybersecurity measures, we refer to third party assessment by the Cybersecurity Assessment Tool of the Federal Financial Institutions Examination Council and the Cybersecurity Framework of the National Institute of Standards and Technology.
- Threat-Led Penetration Testing (evaluation of systems and response processes by analyzing targeted threats and simulating attacks)
Cybersecurity personnel development
We periodically test the group's ability to respond appropriately to a cyber incident, and thoroughly eliminate any issues identified. We consider this process vital in order to strengthen individual and organizational incident response capabilities.
To ensure that every executive officer and employee has the necessary cybersecurity awareness, knowledge, and skills, we employ internal and external training, exercises, and drills including incident response training for management and other staff, role-specific cybersecurity training, and biannual phishing email training for all executive officers and employees.
We actively support employees in acquiring professional qualifications and encourage professional development through external specialist programs. In addition, we actively recruit professionals, and have established an IT system course for new graduates hired in Japan, in order to acquire and develop personnel with advanced expertise.
Declaration of Cybersecurity Management
Mizuho Financial Group, Inc. and each of our group companies* have established a "Declaration of Cybersecurity Management" taking into consideration the "Declaration of Cybersecurity Management" released by the Japan Business Federation (Keidanren) in March 2018.
In consideration of Mizuho's vital role within the social infrastructure as a financial institution, we are proactively implementing cybersecurity measures and doing our part to contribute to building a safe and secure cyberspace environment.
* Mizuho Bank, Mizuho Trust & Banking, Mizuho Securities, Mizuho Research & Technologies, Asset Management One
1. Recognize Cybersecurity as a Management Issue
- Enhance their own understanding of the latest cybersecurity developments and actively engage in management by positioning cybersecurity spending as an essential investment for accelerating DX.
- Take personal responsibility for cybersecurity measures and exercise leadership while recognizing that cybersecurity with a holistic view of the entire supply chain is a critical management issue and confronting risks associated with digitalization.
Cyberattacks are a top–priority management issue for our organization from the perspective of ensuring uninterrupted provision of services for our customers as well as maintaining stable operations and the sustainable growth of our financial infrastructure. Management discusses cybersecurity risks on a regular basis, allocating resources for managing them and taking action to strengthen our security framework.
2. Develop Management Policies and Declare Intentions
- Develop management policies and business continuity plans aimed at prompt recovery from security incidents while prioritizing detection, response, and restoration in addition to identifying and protecting against risks.
- Take the lead in declaring companies' intentions to internal and external stakeholders and make every effort to voluntarily disclose recognized risks, and measures to deal with them, in corporate reporting.
Mizuho, led by our Cyber Incident Response Team, works to strengthen our strategic resilience capabilities through measures such as conducting monitoring via an integrated SOC (security operations center), analyzing computer viruses, and developing and deploying multilayer defense systems.
We believe it is important to keep our customers updated about the efforts we are making to strengthen our cybersecurity, so going forward we will be disclosing this information in our Integrated Report and on our website.
3. Build Internal and External Systems and Implement Security Measures
- Ensure sufficient resources including budgets and personnel, establish internal systems, and take necessary HR, technical, and physical measures.
- Develop human resources and conduct training required for those at every level, including managers, corporate planning staff, technical specialists, and other employees.
- Through the guidelines / frameworks and government support for cyber security measures, manage cybersecurity throughout domestic and international supply chains, including business partners and outsourcing contractors.
We acknowledge that cultivating a professional workforce with high–functioning knowledge of cybersecurity is an important medium– to long–term task for Mizuho. We are working with outside experts to develop our workforce and motivate our employees in this direction.
By conducting training at every personnel level and participating in cross–industry exercises, we are also enhancing the effectiveness of our internal frameworks and procedures.
We strive to ensure the integrity of our supply chain by monitoring cybersecurity at our contractors and business partners.
4. Contribute to Widespread Use of Cybersafe Products, Systems, and Services
- Manage cybersecurity across the full spectrum of corporate activity, including development, design, production, and supply of products, systems, and services.
We undertake a wide range of cybersecurity countermeasures to protect our customers' assets from criminal activity. In terms of internet banking, these measures include providing security software for our customers, optimizing verification systems, and monitoring transactions.
Through our website and other mediums, we also send notifications regarding potential password exploitation and virus infections to ensure the safety of our services.
5. Contribute to Building Safe and Secure Ecosystems
- Collaborate with relevant government agencies, organizations, industry associations, and other bodies to actively share information, engage in dialogue, and build human networks, both in Japan and internationally.
- Contribute to reinforcement of cybersecurity throughout the supply chain as well as society by raising awareness of measures taken on the basis of such information.
In the closely–connected world in which we live, we believe it is important to further optimize coordination between social institutions, both in times of crisis and in times of stability. That is why we are constantly working to create and maintain reliable communication and information–sharing structures regarding cybersecurity with government institutions, regulatory authorities, law enforcement agencies, the Financial Services Information Sharing and Analysis Center, and the Financials ISAC Japan.
We proactively share the information we glean from research and analysis with external parties in order to benefit society at large.
Compliance
Basic Approach
One of our core business principles is the strict observance of all laws and regulations and the pursuit of fair and honest corporate activities that conform to socially-accepted norms, and as such we have established a compliance framework befitting a global financial group.
We are committed to implementing a compliance framework to practice fair and honest corporate activities in order to live up to the trust of our customers and society, and we are constantly aware of the weight of our social responsibility and public mission as a provider of economic and social infrastructure.
- We are committed to enhancing our compliance framework in light of changes in the environment and increasing demands globally, such as the prevention of money laundering, the severance of relationships with organized crime, and the response to stricter global regulations regarding market transactions and personal information management.
- We will strive to create a culture, through messages from management and training, in which each and every employee practices compliance autonomously.
Compliance Structure
Mizuho Financial Group and its core group companies discuss important matters concerning compliance at each company's Compliance Committee (chaired by their respective CCOs), and promote compliance under the leadership of the Group Chief Compliance Officer (CCO) and the companies' respective CCOs.
At each organizational unit (such as branches and departments) in each company, the general manager, as the head of the organizational unit, is responsible for guidance and implementation related to compliance matters, and the compliance officer or compliance administrator at each organizational unit reviews the status of compliance.
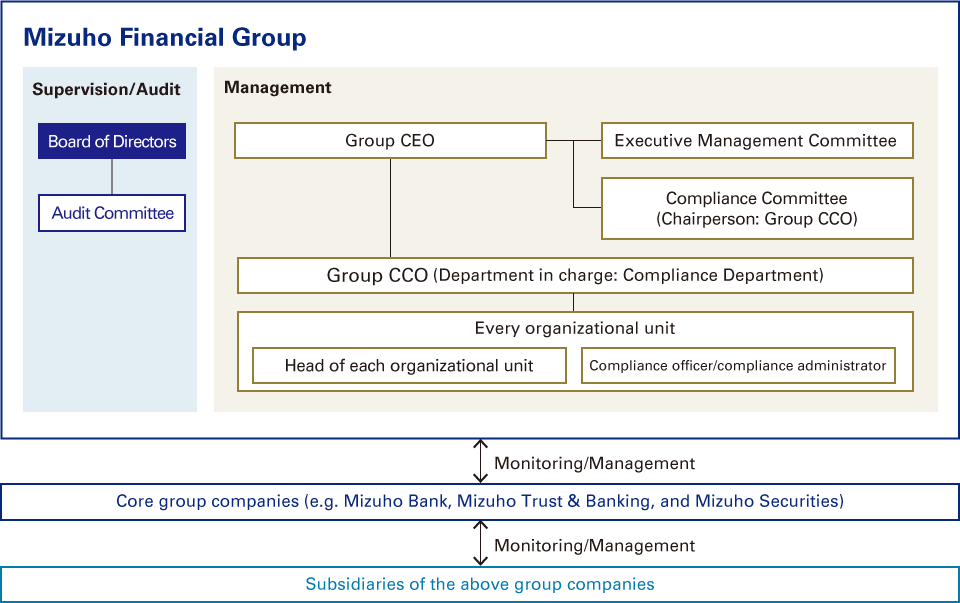
Compliance Practices
We have established the Mizuho Code of Conduct which sets forth clear and concrete standards of ethical behavior to be followed when implementing the precepts of our Corporate Identity. Based on the revision of our Corporate Identity and changes in the outside environment, we have recently revised the Code of Conduct to make the content simple and enduring while setting forth the key points that all executive officers and employees should understand.
Furthermore, each of our group companies has also prepared a compliance manual, that clarifies the laws and regulations that we must observe in our business operations and the compliance practices we are required to follow. Mizuho ensures that all executive officers and employees are fully acquainted with both the Code of Conduct and the compliance manual's content through ongoing training and messages from management.
We monitor the status of compliance levels through self-assessments by each department and monitoring conducted by the compliance department of each company. In addition, every fiscal year, each of our group companies formulates a compliance program which is a concrete, practical plan for enhancing the compliance framework, conducting training, checks, and the like in light of changes in the domestic and international market transaction environment and increasing demands such as for prevention of money laundering and protection and management of personal information on a global basis. Progress on the compliance program is monitored every six months.
Financial Crime Risk Management
Financial crimes are becoming more diverse and sophisticated, and acts of terrorism continue to occur around the world. In light of these trends, measures for anti-money laundering (AML), combating the financing of terrorism (CFT), and counter-proliferation financing (CPF) are extremely important. Against this backdrop, the key challenge for financial institutions is the strengthening of their AML/CFT/CPF measures. As a financial services provider operating globally, Mizuho Financial Group is subject to the laws and regulations of both Japan and the other jurisdictions where it operates, as well as to supervision from financial regulators based on those laws and regulations. Accordingly, being aware that money laundering / financing of terrorism is one of our top risks, we have formulated a framework to ensure compliance with the related laws and regulations in each jurisdiction and we are also continually enhancing our AML/CFT/CPF measures. By preventing the transfer of criminal proceeds and cutting off the supply of funds to terrorist organizations, we contribute to the protection of our customers, the security of the international community, and the sound development of economic activities.
Mizuho Bank, the core bank of our group, is mainly engaged in the following AML/CFT/CPF measures.
・When establishing business relations with a new customer, we conduct CDD*1 in accordance with relevant laws, regulations, internal rules, and/or procedures so as to verify the customer's name, address, date of birth, purpose of the transaction, occupation, business, beneficial owner, etc. We also work to update customer information on an ongoing basis after business relations have been established(Ongoing Due Diligence).
・When conducting CDD, we use official documents and refer to official sources of information that support the authenticity of the customer's declarations. In the case of non-face-to-face transactions, we also certify identification documents and confirm the content of the declaration and the purpose of the transaction with the customer, etc.
・During CDD, we also check whether the individual is considered a terrorist or suspected terrorist, as designated by a resolution of United Nations Security Council or by applicable laws and regulations to each of our offices.
・We manage risk in a way that is commensurate with the location, magnitude, and nature of the risk of money laundering, etc., that we face, depending on the customer's occupation, business, the products being transacted, and the country/region involved in the transaction. For example, at the outset of a business relation and on a regular basis, we confirm whether the customer falls within the category of foreign PEPs*2 as defined by relevant laws and regulations. And if customer is a foreign PEP, we conduct enhanced due diligence, require senior-manager approval, and conduct monitoring based on the risks involved.
・In order to enhance the knowledge and expertise of our officers and employees in implementing the AML/CFT/CPF measures, we conduct regular and as-needed training and testing for all those involved in the AML/CFT/CPF measures, and we encourage them to obtain relevant professional certifications.
・We also conduct monitoring and internal audits based on annual plans, and we obtain evaluations and opinions from external experts, in order to maintain and improve the effectiveness of our AML/CFT/CPF measures.
・We retain documents required for AML/CFT/CPF measures, in accordance with applicable laws, regulations, internal rules, and procedures. Specifically, transaction and confirmation records under the Act on Prevention of Transfer of Criminal Proceeds are retained for at least seven years either at the time of the transaction or after its completion.
*1 CDD: Customer Due Diligence
*2 PEPs: Politically Exposed Person(s)
Our Stance towards Organized Crime
In order to prevent organized crime from being involved in our business activities and to prevent any harm caused by them, the Mizuho Code of Conduct includes a policy covering our zero-tolerance stance on business relationships with individuals or organizations that are in any way associated with organized crime and therefore threaten the order and safety of civil society.
We have also formed an Anti-Organized Crime Committee which includes external experts in industry-specific, in-depth discussions on this subject, in addition to other initiatives we are implementing on a group-wide basis to ensure that we have no direct or indirect associations with organized crime. Moreover, drawing on the discussions in this committee, these matters are also discussed and reported on at meetings of the compliance committees of Mizuho Financial Group, Mizuho Bank, Mizuho Trust & Banking, and Mizuho Securities.
Furthermore, core group companies have established departments dedicated to responding to organized crimes, appointed an officer responsible for responding to unreasonable demands, formulated a manual on how to manage such issues, and established a framework for conducting training. If required, we consult with third-party experts and authorities on the handling of specific cases.
Mizuho's initiatives to prevent bribery and corruption
With the enactment of relate laws and regulations and the heightened public concern for bribery and corruption in Japan and other countries, Mizuho Financial Group Inc. implements appropriate measures to prevent bribery and corruption.
The Mizuho Financial Group acknowledges the social significance of preventing bribery*1 and corruption*2. By prohibiting executives and employees from involving in bribery and corruption and promoting fair and honest conduct, it aims to maintain and develop sound corporate activities.
The Mizuho Financial Group prevents bribery and corruption conducted through the following activities:
- Exchange of entertainment and gifts (Note 1)
- Donation
- Recruitment, etc.
- Facility payment *3
- Conclusion of contracts for outsourcing operations and engaging third parties
- Corporate acquisitions
- Other acts related to duties
To implement the above initiative, our company has formulated manuals and operating procedures, etc. that stipulate the specific procedures, and implements training to executives and employees to ensure compliance with the procedures.
Moreover, we conduct risk assessment on bribery and corruption on an annual basis, and manages the risks according to the assessment results. Further, our company will monitor the implementation status of the above, to enhance the framework for complying with the Anti-Bribery Acts, etc. in a continued manner.
In addition, our company seeks understanding from related contractors using the document "Request for Your Understanding and Cooperation on Mizuho’s Stance and Initiatives on Bribery, etc.”
(Note 1) Regarding entertainment and gifts, we ensure that they are conducted legally and within the scope of socially accepted norms in terms of frequency, purpose, and amount. We have established a framework to conduct checks in order to prevent compliance-related problems such as misconduct and collusion, including exchange of entertainment and gifts with public officials that are prohibited in principle.
*1 "Bribery" refers to “the act of providing and receiving bribes”.
- "Act of providing bribes" refers to the act of offering, proposing, or promising a bribe, directly or indirectly, to public officials, foreign public officials, or third parties, regardless of the purpose (not limited to obtaining benefit for oneself or a third party)."
- "Act of receiving bribes" refers to the act of receiving, demanding, or promising a bribe in connection with one's duties, regardless of the purpose (not limited to obtaining benefit for oneself or a third party)."
*2 “Corruption" refers to the act where public officials or foreign public officials abuse their public office or authority, causing violations of applicable laws and regulations of Japan and other countries related to bribery (collectively referred to as 'Anti-Bribery Laws')."
*3 “Facilitation payment” refers to payments made to facilitate administrative services for the purpose of obtaining undue benefit in corporate activities and business promotion.
Measures for Ensuring Compliance
At Mizuho, compliance-related education and training are key measures for ensuring appropriate compliance.
During fiscal 2022, Mizuho continued to provide effective training tailored to a broad range of roles within the organization. We conducted effective training sessions, including mandatory compliance training sessions for all employees; role-specific training for executive officers, general managers, compliance officers, and other senior management members; and 24 e-learning training sessions on specific compliance topics.
Main training themes
- Fiduciary duties
- Management of customer information (firewall rules, etc.)
- Severing relations with anti–social elements
- Recent corporate scandals
- Insider trading regulations
- Prevent money laundering
- Entertainment, gift-giving
- Compliance hotline
In addition to understanding the rules and procedures, the training is designed to deepen understanding of the purpose and background of laws and regulations, and to provide points to note regarding responding to compliance risks in a timely manner. We will continue to improve this content going forward.
In addition to the measures to ensure compliance, we are also dedicated to detecting potential compliance issues at the earliest stage possible and taking appropriate action. Furthermore, each group company has established a hotline which executive officers and employees can call in order to speak with dedicated persons in the Compliance Division or an external law office or compliance professional.
Internal Reporting System (Compliance Hotline)

Our company has a group-wide internal reporting system that is available 24 hours a day, every day of the year that connects to external contact points (a company dedicated to internal reporting and a law firm, both of which are independent from our company group). The system also offers service in English and accepts anonymous reports. In order to ensure that all executive officers and employees, etc. are fully aware of the internal reporting system, we provide in-house trainings, post posters at each workplace, and distribute credit card-sized cards with information on various contact points. Moreover, we are also working to improve its effectiveness by regularly disseminating information on internal reporting cases without specifying the details, and by thoroughly ensuring the protection of whistleblowers (prohibiting the investigation, unfavorable treatment, and retaliation against whistleblowers).
In fiscal 2023, the Mizuho group received a total of 175 reports through our internal and external contact points, with the response status reported to members of our Audit Committee.
Hotline for Accounting and Auditing
We have a special hotline to receive reports from both in and outside the company regarding inappropriate matters on accounting and financial reports, which connects to an external law office.
Our audit hotline, which connects to an external law office, is available to receive reports from both in and outside the company in connection with concerns regarding accounting and financial reports.
Reporting Items
Mizuho Financial Group has established a hotline to receive reports from in and outside the company in connection with problems concerning internal control and audits of accounts and financial reports.
Contact Point
This hotline has been established within an external law office. Reports can be made via postal mail or email.
- When a report is received concerning the reporting items stipulated on the left, Mizuho Financial Group will make a reasonable effort to investigate the facts behind the information received and report back on the results.
- Anonymous tips are also acceptable, but there are cases where it will not be possible to fully satisfy the intentions behind such tips owing to constraints on investigations and the inability to report back.
- Information on persons making such reports is not disclosed to third parties other than the group companies except in cases where the assent of the person in question has been obtained or such disclosure is required under laws and ordinances.
Governance Related Information
Crime prevention
Mizuho, as part of its social responsibility as a bank, is working proactively to implement a wide range of measures against losses resulting from money laundering, terrorist financing, and losses as a result of illicit deposit withdrawals using cash cards (ATM cards), Internet banking, etc. and bank transfer fraud.
Initiatives to prevent losses resulting from illicit deposit withdrawals
Transition from regular cash cards (ATM cards) to smart IC cards
Mizuho Bank has substantially expanded its lineup of IC cash cards (ATM cards), including Mizuho Mileage Club Card and is actively issuing IC cash cards (ATM cards), which are considered more difficult to counterfeit than conventional magnetic stripe cards.
Biometric authentication via finger vein patterns
Mizuho Bank has adopted a biometric authentication system that identifies customers based on data of their vein patterns, which differ from one individual to another. Mizuho has installed in the ATM areas, ATMs which have this identification feature.

Internet banking
Recently, there has been an increase in losses as a result of illicit deposit withdrawals using Internet banking.
For individual customers, Mizuho Bank has introduced a transaction authentication function*1 and an e–mail method*2 both of which involve the use of a one–time password. In addition, Mizuho Bank is working to provide its customers greater peace of mind through measures such as monitoring banking activity 24 hours a day, 365 days a year to detect suspicious transactions and offering antivirus software at no charge to its customers.
For corporate customers, Mizuho Bank has introduced a function that separates the authority for approving bank transfers from the authority for preparing such transfer data. In addition to "double approval" function, where two people with approval authority must give approval for transactions, Mizuho Bank also provides anti–virus software at no charge to its customers, and has introduced IC cards for electronic certificate and a transaction authentication function*1. The aim of undertaking these measures is to strengthen security and give customers greater peace of mind.
*1 Transaction authentication function
This is a strong security measure, and it is used for transfer to non–registered transfer destination.
When you enter the account number of the transfer destination using the dedicated card or smart phone app, a one–time password will be issued. This one–time password and the transfer account number are linked, and confirmation of the transfer destination is achieved when specified by the customer. Illegal remittance due to illegal rewriting of the transfer destination or account information can be prevented.
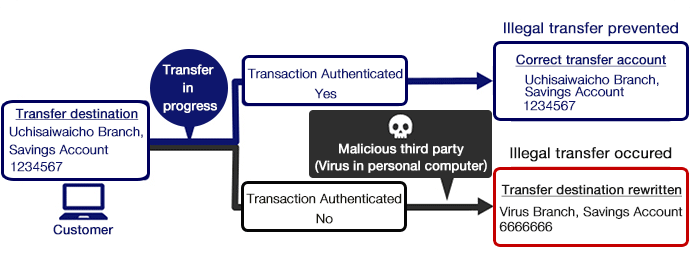
*2 E–mail method one–time password
To prevent illegal remittance, additional identity verification may be required during transactions such as transfers. In such cases, Mizuho Bank sends an identification number to the customers' registered e-mail address. This number must be input to proceed with the transaction. This e–mail method has proved to be effective in preventing illicit deposit withdrawals.
Activities to prevent losses to customer due to bank transfer fraud
Recently the number of incidents where customers incur losses due to bank transfer fraud has been rising. Common examples include cases where the caller poses as a police officer or employee of a bankers' association and requests the party to hand over or transfer a certain amount of money to an account. In other cases, the caller poses as an employee of the pension offices, pretends to return medical expenses, and makes a party remit a fund. Another tactic is to pose as a brokerage, offer to sell bonds, pre–listed shares, etc., and cheat a party out of his or her money.
Mizuho Bank and Mizuho Trust & Banking are stepping up their activities to prevent these incidents by having bank branch employees say a word of warning as they monitor customers at teller windows and ATMs. Other activities are preparation of posters, flyers, website messages, ATM screen messages, etc. that warn customers about these deceptive practices. Also, at the time of opening an account, Mizuho Bank works to prevent the opening of accounts that can be abused for bank transfer fraud by checking the identity in line with laws and regulations and checking the purpose of opening the account.
At each of the branches of Mizuho Bank and Mizuho Trust & Banking, the above–mentioned activities are being continued to prevent such incidents in advance.
Mizuho is providing compensation and providing allocations based on various relevant legal provisions.
Mizuho Bank provides advice on compensation to individual customers who are victimized by illicit deposit withdrawals.
Based on the Depositor Protection Law*1, Mizuho Bank and Mizuho Trust & Banking provide compensation for losses caused by counterfeited or stolen cash cards (ATM cards).
Mizuho provides compensation to those who have been victimized as a result of stolen passbooks and illicit deposit withdrawals using the Internet banking, based on "Arrangements Agreed Upon and Announced by the Japanese Bankers Association."*2
Mizuho Securities provide compensation for losses caused by counterfeited or stolen cash cards (ATM cards) based on self–regulatory rules of the Japan Securities Dealers Association*3
*1 Depositor Protection Law
"Act on Protection, etc. of Depositors and Postal Saving Holders from Unauthorized Automated Withdrawal etc. Using Counterfeit Cards, etc. and Stolen Cards, etc." (Effective February 2006)
*2 Arrangements Agreed Upon and Announced by the Japanese Bankers Association
Arrangements regarding compensation for losses incurred in connection with transfers under false pretenses using stolen passbooks and Internet banking. (Disclosed February 2008)
*3 Self–regulatory rules of the Japan Securities Dealers Association Regulation in relation to protection of customers from unauthorized withdrawals using counterfeited or stolen cash cards (ATM cards) (Announced February 2006)
Initiatives to deal with losses as a result of bank transfer fraud
Based on the "Law for Dealing with Deceptive Transfer Practices"*, allocations are made from the accounts used for deceptive practices to help victims to recover from losses incurred as a result of such practices. Mizuho Bank has established a specialized consultation desk and facilitates smooth implementation of the law.
* Note: Law for Providing Relief from Deceptive Transfer Practices
"Act on Damage Recovery Benefit Distributed from Funds in Bank Accounts Used for Crimes" (Effective June 2008)
Consultation Desks
In addition to consultation desks in bank branches, the following specialized advisory services are available:
For seeking compensation for losses as a result of illicit deposit withdrawals
- Mizuho Bank Customers:
Security Support Center
0120–868–715* - Mizuho Trust & Banking Customers
Compliance Support Department
0120–868–715*
For payment of funds to recover from losses as a result of bank transfer fraud
- Mizuho Bank Customers
Call Center for Customers Who Are Victims of Bank Transfer Fraud
0120–233–862* - Mizuho Trust & Banking Customers
Financial Crimes Compliance Department
03–6630–8772*
* Business hours: Monday to Friday 9 am to 5 pm (Except bank holidays)
Available only in Japanese language
Customer-oriented Approach
Basic approach
Mizuho regards adhering to integrity—or, in other words, acting as a trusted partner by always upholding solid moral principles—as one of the values we pursue in realizing our stated Purpose, which is to "Proactively innovate together with our clients for a prosperous and sustainable future". We believe that garnering customers' trust through our customer-oriented approach will lead to garnering trust from all of our stakeholders and this will underpin our sustainable growth.
Identifying customer needs and expectations and utilizing them in our corporate activities
Mizuho regards the customer comments that we receive through various channels as a valuable asset in our corporate activities. We work to identify customers' diverse and constantly changing needs and expectations, improving our service quality accordingly so that we can continue to provide products and services preferred by customers. We have created a cycle whereby the current status of group companies' efforts is reported to Mizuho Financial Group for verification and consultation, leading to further improvements.
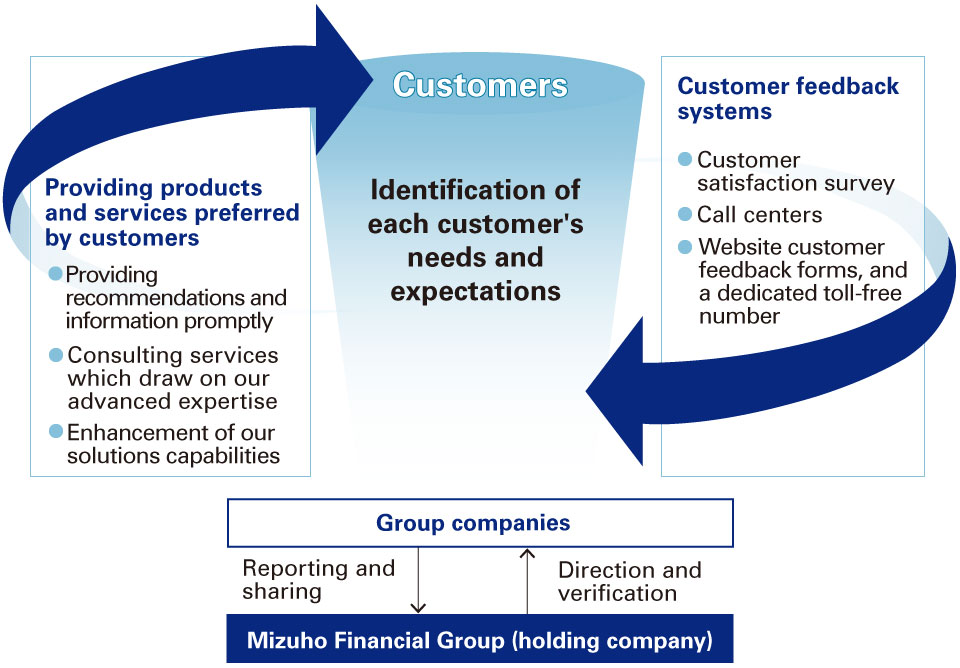
Customer feedback channels
Mizuho Bank, Mizuho Trust & Banking, and Mizuho Securities garner customer feedback through multiple channels:
- Regular customer satisfaction surveys seeking customer views on our products, services, recommendations, etc.
- Call centers responding to customer opinions and requests
- Website feedback forms and a dedicated toll-free number to gather customer opinions and requests
Asset management-related business
We have released our Policies Regarding Mizuho's Fiduciary Duties* as a set of group-wide policies to ensure we continue offering products and services that genuinely serve the best interests of our customers. In addition, at our holding company and at relevant group companies, we have established, made public, and executed action plans based on these policies.
* Fiduciary duties is a general term for the broad range of roles and responsibilities that fiduciaries are expected to fulfill when engaging in certain business activities in order to live up to the trust that is placed in them by their customers.
For more information on Policies Regarding Mizuho's Fiduciary Duties, please see our website:
Policies Regarding Mizuho’s Fiduciary Duties (PDF/337KB)
Our vision for the pursuit of customers' best interests
We believe that protecting and growing financial assets and helping our customers achieve their goals by providing products and services that are truly appropriate for the customer's interests will lead to the achievement of the customer's best interests.
At the same time, we aim to utilize the medium- to long-term growth of Mizuho to further enhance our level of customer service by expanding our business base and establishing a brand based on customer satisfaction and trust.
Key Performance Indicators (KPIs)
We have established KPIs to confirm our level of performance in customer-oriented business conduct. We publicize progress on these KPIs periodically, along with the status of initiatives under our Action Plan.
.jpg)
In addition to the KPIs listed above, the following common KPIs have also been released.
Common KPIs
(1) Customer ratio by investment profit/loss from investment trust funds/fund wraps, (2) Cost vs. return of the best-selling investment products in terms of the balance of investment trust assets under management, (3) Risk vs. return of the best-selling investment products in terms of the balance of investment trust assets under management, (4) Customer ratio by investment performance of foreign currency-denominated insurance products, (5) Cost vs. return of foreign currency-denominated insurance products.
Common KPIs are indicators based on the "Common Key Performance Indicators (KPIs) Comparable Across Investment Trust Distributors" published by Japan's Financial Services Agency in June 2018 and the “Common Key Performance Indicators (KPIs) Comparable Across Foreign Currency-denominated Insurance Distributors" by Japan’s Financial Services Agency in January 2022.
Initiatives regarding Mizuho's fiduciary duties (PDF/8,583KB)
Business Continuity Management
In light of our social responsibility and the important role Mizuho plays within the social infrastructure as a financial institution, ensuring the continuity of financial settlement functions and the swift and efficient recovery of operations in the event of an emergency is one of our top priorities within the group.
To improve business continuity management practices across the group, we assess the potential impact of emergencies beforehand and formulate necessary countermeasures in order to minimize such impact, and to ensure the swift and efficient recovery of operations.
One of the ways in which we are working to achieve this is by establishing Crisis Management Offices within Mizuho Financial Group, Mizuho Bank, Mizuho Trust & Banking, Mizuho Securities, and Mizuho Research & Technologies that are responsible for business continuity management and our responses in the event of emergency. These offices function as a controller in the event of an emergency that may materially impact business management, by collecting and analyzing information, formulating countermeasures, and taking other necessary action. In addition, their role includes collecting and analyzing signs and indicators of a potential crisis, and reporting their findings promptly to management.
Particular focus is placed on continuous efforts to confirm the content and processes of our system and business contingency plans and strengthen our group-wide, hands-on training and drills with management participation, in order to minimize the impact on customers in the event of an IT system failure.
We are also strengthening our first response to natural disasters, covering not only earthquakes and tsunamis but also large-scale wind or water damage, and improving readiness against terrorism and conflict as well as cyberattacks in order to improve the effectiveness of our business continuity management system for securing operational resilience.
Internal Audit Structure
Basic approach
Internal audit refers to a series of activities, ranging from the objective and comprehensive evaluation of the effectiveness and appropriateness of each process relating to governance, risk management, and control to the provision of recommendations and corrective guidance, etc. toward the resolution of problems, under the supervision of the Board of Directors, with organizational independence ensured.
Through this series of activities, internal audits assist the Board of Directors of each of our group companies to fulfill their role of supervising management efficiently and effectively. In line with the Basic Policy for Internal Audit established by Mizuho Financial Group, our principal banking subsidiaries and other core group companies conduct internal audits, which include the internal auditing of their respective subsidiaries.
In addition, with respect to the management of risks applicable across the Mizuho group, we coordinate internal audits throughout the group to assess the risk management status of the group as a whole.
Internal audit management structure
Mizuho Financial Group (holding company)
Our Internal Audit Group is independent from other departments and business processes at Mizuho Financial Group.
The Internal Audit Group conducts internal audits of Mizuho Financial Group, and centrally monitors and manages the status of internal audits at our core group companies, by verifying the internal audits and internal control structure at each company based on reports submitted by those companies.
The Group Chief Audit Executive (Group CAE) reports functionally to the Board of Directors and the Audit Committee on important matters related to internal audits.
Also, as the person in charge of internal audit, the Group CAE reports administratively on the status of internal audit operation management to the Group CEO directly or through the Internal Audit Committee.
Mizuho Bank and Mizuho Trust & Banking
The Internal Audit Groups at both Mizuho Bank and Mizuho Trust & Banking are independent from their respective other departments and business processes.
The progress and results of individual audits and plans are reported to their respective Audit & Supervisory Committees, and their respective Internal Audit Groups respond to requests for inspections and receive specific instructions from their respective Audit & Supervisory Committees.
In addition, they have also both established Internal Audit Committees that discuss and make decisions on all important matters regarding their respective internal audits.
Both banks have established internal audit departments to conduct internal audits at their respective business offices in and outside Japan, head office departments, and group companies. Specifically, the internal audit departments assess the suitability and effectiveness of business activities associated with compliance and risk management.
Other core group companies
Other core group companies have also established effective and efficient internal audit structures adapted to the characteristics of their respective businesses.
Internal audit management structure
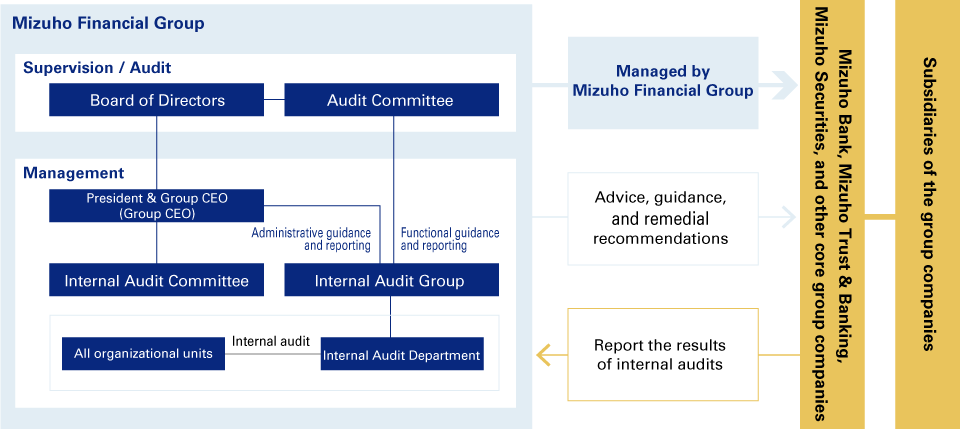
Support for SMEs and regional revitalization
Support for small and medium–sized enterprises (SMEs)
By drawing on our consulting capabilities to provide proposals and solutions that address the issues SMEs face, we ensure that clients' perspectives are prioritized when providing support for business expansion, succession, reorganization, and other client needs. We also believe that proactively supporting SMEs is a key part of fulfilling our social responsibility as a financial institution.
In particular, by providing consulting and support for SMEs' growth strategies, we can introduce clients to potential M&A opportunities from the standpoint of business expansion and succession, and support the growth of innovative companies with exceptional technologies or ideas.
Furthermore, a specialized business reorganization section within our Head Office provides support for SMEs' business improvement and reorganization needs. In addition, our Head Office collaborates with frontline offices to provide consultations and support for clients through partnerships with external organizations, external specialists, and other financial institutions.
Regional revitalization initiatives
In Japan, as a result of the trend toward concentration of businesses and other economic activity solely in Tokyo, rural populations are expected to decline and regional economies are expected to shrink in the future. As a nation, Japan must look for ways to revitalize regional areas through a virtuous cycle in which jobs draw people back to local areas and population growth creates more jobs.
Utilizing our office network in Japan, we are striving to promote the revitalization of regional economies by providing our clients with funding, supporting the operations of local businesses, and collaborating with regional governments.
Case study: Efforts to revitalize local economies through business revitalization support
At Mizuho Bank, we are drawing on our strengths as a group with offices in all 47 prefectures of Japan to support regional industry revitalization.
This involves co-creation with startups and local companies, business matching and business succession between local companies, assistance to companies seeing declining performance, and other efforts. The main organizational body driving our support is our Regional Revitalization Desk, which houses our headquarters functions for planning and promoting initiatives towards resolving issues faced by local communities.
For example, in May 2024 we provided support including loan and capital financing of JPY 4.5 billion to the Nobels Group, a large agricultural corporation in Hokkaido's Tokachi region, in collaboration with the Regional Economy Vitalization Corporation of Japan, government-affiliated financial institutions, regional financial institutions, and others. The Nobels Group faced a challenging business environment due to rising feed prices, falling beef prices, and other factors, but has significant business resources as one of the largest agricultural businesses in Japan, with advanced technological capabilities and a circular business model. Our support for its revitalization has profound significance in contributing to the maintenance and development of the regional economy and supporting local employment.
Going forward, we will help to revitalize regional economies through targeted support for companies that are of importance to local communities.
.jpg)
Compliance with international financial regulations
The Basel standards, a unified international regulatory framework for ensuring the soundness of banking institutions, were first created in 1988 (now referred to as Basel I). As the financial services industry and world affairs have developed, steps have been taken to steadily enhance this framework. Formulated in 2010, Basel III is a framework that tightened capital requirements along with introducing liquidity requirements to address issues that came to light in the 2008 global financial crisis. Regulatory reforms following the financial crisis were largely completed in 2017 (Basel III finalization) with reforms aimed at reducing discrepancies among banks regarding the calculation of risk-weighted assets (RWA, which is the denominator of the capital ratio).
.avif)
Principal requirements under Basel III and state of compliance
As a Global Systemically Important Bank (G-SIB), Mizuho Financial Group must meet some regulatory standards at a higher level. We maintain full compliance with all the requirements in the standards and, going forward, we will steadily accumulate capital and control our balance sheet to ensure that we can satisfy any new requirements that are introduced.
.avif)
International financial regulations going forward
With the completion of the post-global financial crisis regulatory reforms, the Financial Stability Board and the Basel Committee on Banking Supervision, which are responsible for developing international financial regulatory standards, are turning their attention to new areas. Specifically, they have shifted their focus from developing new regulatory standards to consistent implementation of regulations in individual countries and evaluating the impact of regulatory reforms (e.g., are they having the intended effect without compromising regulatory resilience). Recently, responding to the banking turmoil of 2023, the Basel Committee on Banking Supervision reaffirmed their expectation of implementing all aspects of the Basel III framework in full, consistently, and as soon as possible.
In addition, the environment that financial institutions operate in has reached a critical turning point, including rapidly accelerating digitalization and increasing societal interest in sustainability. There is growing attention to, and international discussion about, the opportunities and risks presented to banks and financial systems by the various impacts of climate change and the popularization of digital assets. For example, various international bodies and local regulatory authorities, foremost among them the Financial Stability Board and the Basel Committee on Banking Supervision, have been looking into responses to risks related to digital assets and climaterelated financial risk.
To address these various risks, we will work closely with government, academia, and industry, while also holding proactive internal discussions.
Basic Stance toward Tax
For companies operating on a global basis, efforts to comply with the tax laws of each jurisdiction and enhance tax management are becoming increasingly important. In this business environment, in order to operate responsibly and transparently with foresight, serve client needs, enable our people to flourish, and help to improve society and the communities where we do business, Mizuho is working under the direction of our Group CFO to fulfill our tax liabilities appropriately in the jurisdictions where value is created in our business activities, in compliance with applicable tax laws and regulations in any jurisdictions, as well as tax guidelines published by international institutions such as the OECD. We do not operate in tax-free or low tax jurisdictions (known as tax havens) where the sole aim of business is to achieve tax avoidance or profit shifting which are against the spirit of tax laws. We are also working to strengthen the tax literacy of Mizuho employees through internal education and training about the Tax Policy described below and our approach to tax matters.
Tax Policy
Through resolution of the Board of Directors, we established and publicly released a Tax Policy, which sets forth a group–wide, uniform approach to tax matters to fulfill our corporate social responsibilities, and to increase corporate value by establishing and enhancing our credibility and reputation in the eyes of shareholders, investors, and all customers across the globe. The Group CFO also report, whenever necessary on a case–by–case basis, on tax–related issues or efforts to the Board of Directors, Audit Committee, Executive Management Committee, and the President & CEO.
Tax Policy
This policy establishes the basic provisions relating to the appropriate fulfillment of tax liabilities by the Mizuho group as a whole, which is one of our important corporate social responsibilities.
Legal Compliance
We are committed to comply rigorously with applicable tax laws, regulations, circular notices, guidelines, and tax treaties in any jurisdictions where we operate, and to fulfill appropriate tax liabilities.
We do not engage in any business activities where the sole aim is to achieve tax avoidance or profit shifting which are against the spirit of tax laws.
Transfer Pricing Taxation
We carry out cross–border transactions with overseas affiliates at arm's length prices in accordance with the OECD Transfer Pricing Guidelines.
Tax Planning
We seek to manage our tax costs appropriately by eliminating double taxation under applicable tax treaties, and by utilizing incentives, reliefs, and exemptions in line with the spirit of tax laws.
Transparent Disclosure
We endeavor to disclose our Tax Policy and tax–related information in a fair, timely, and appropriate manner.
Relationship with Tax Authorities
We seek to build and maintain good relationships with tax authorities through constructive dialogue.
Basic Stance toward Customers
We provide the highest quality financial services to our customers, and do not provide products and services where the sole aim is to achieve tax avoidance and profit shifting which are against the spirit of tax laws.
Current Corporate Income Taxes by Country (FY2024)
Tax Jurisdiction
Revenue
Profit (Loss) before Income Tax
Income Tax Accrued - Current Year
Amount
Share
Income Tax Paid (on Cash Basis)
Number of Employees (persons)
JAPAN
4,329
407
72
25.9%
34
40,883
UNITED STATES
3,693
327
101
36.1%
107
3,579
UNITED KINGDOM
960
76
21
7.6%
12
1,801
SINGAPORE
261
43
6
2.1%
9
1,225
HONG KONG
216
35
5
1.9%
8
883
CANADA
173
18
7
2.4%
8
75
AUSTRALIA
150
33
9
3.3%
9
218
CHINA
98
38
9
3.1%
8
1,527
THAILAND
86
43
9
3.2%
8
490
BRAZIL
79
5
0
0.0%
1
82
INDONESIA
77
17
5
1.8%
4
379
INDIA
66
23
9
3.2%
9
729
TAIWAN
61
15
1
0.5%
1
324
KOREA
49
22
4
1.5%
6
275
Others
228
72
21
7.4%
21
1,645
Total
10,528
1,175
278
100.0%
245
54,115
Notes
- The figures shown above are based on the Country-by-Country Report (CbCR) submitted to the Japanese tax authorities and are those for the top fourteen jurisdictions in terms of Revenue.
- The details of each item are as follows:
- Revenue: Ordinary income (excluding intra-group dividend income) and extraordinary gains reported on P/L statement of each company
- Profit (Loss) before Income Tax: Profit (loss) before income taxes reported on P/L statement of each company (excluding intra-group dividend income)
- Income Tax Accrued: Income taxes reported on P/L statement of each company (excluding additional income taxes for prior fiscal years and deferred income taxes under deferred tax accounting), calculated based on taxable income after tax adjustments to profit (loss) before income taxes.
- Income Tax Paid: Income taxes paid during the applicable fiscal year